Market Trends
February 2026 Market Smart:
The Split Deepens
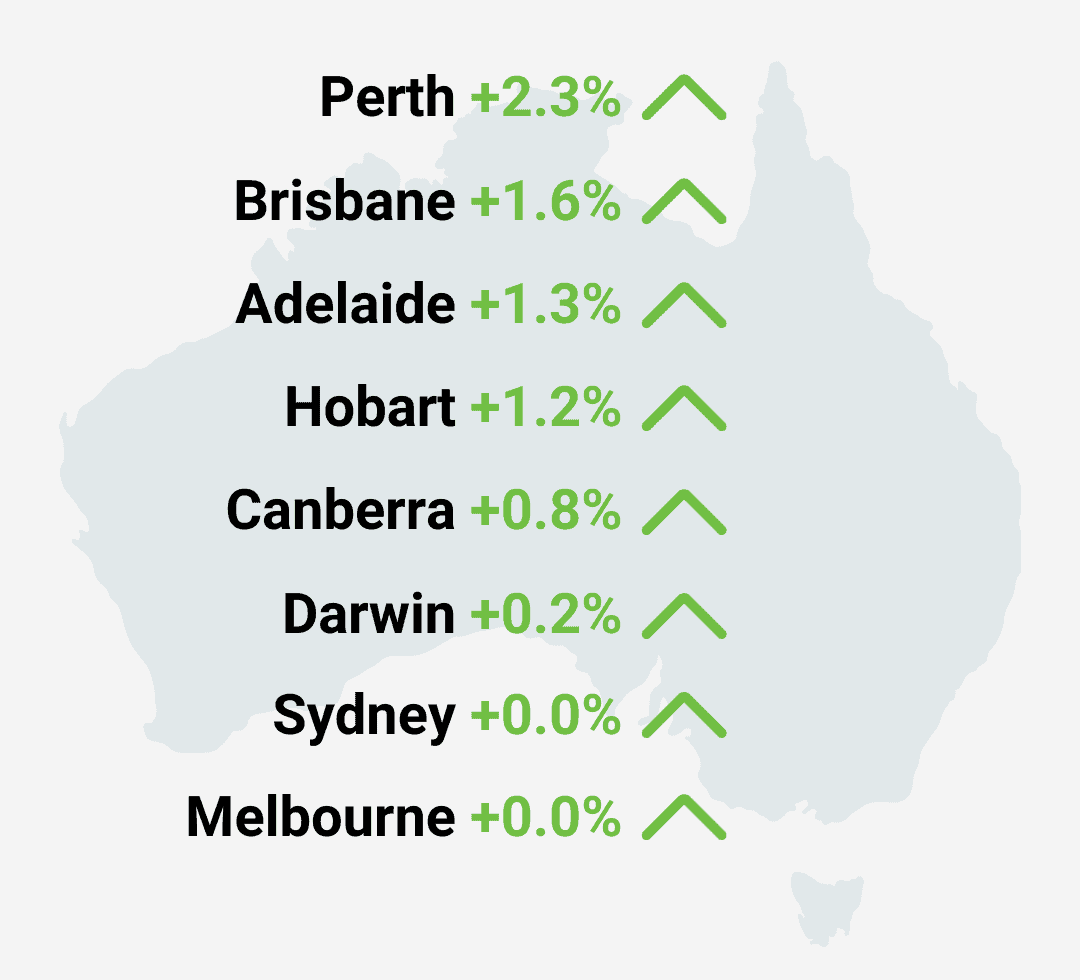
Two months into 2026, and Australia’s housing market has split cleanly down the middle. Perth surged 2.3% in February, adding more than $27,000 to the median dwelling value in a single month. Brisbane and Adelaide both climbed above 1%, while Darwin, despite easing slightly, still delivered 19.4% annual growth.
But Sydney and Melbourne? Completely flat at 0.0%, weighed down by the February rate hike and collapsing confidence. With Perth listings 48% below the five-year average and Sydney vendors suddenly rushing to market, this is no longer a two-speed market. It’s a full-blown divergence.
Key Take Aways
Melbourne's west defies the headline
While Melbourne’s overall growth stalled at 0.0%, whilst the western growth corridor continues to dominate professional investor research at 9.0% of national activity, the highest of any region in Australia.
Sydney and Melbourne pause, but fundamentals remain
Both cities are negative over the rolling quarter, but lower quartile areas are still delivering growth. Sydney’s affordable suburbs rose 0.8% while the top end fell.
Perth breaks away
Perth jumped 2.3% in February and 22.0% annually, the strongest capital city performance by a wide margin, adding $27,000 in a single month.
Supply imbalance drives divergence
Perth listings sit 48% below the five-year average, Brisbane down 31%, Adelaide down 23%, while Sydney and Melbourne are only marginally below average.
Lower quartile drives all growth
In Sydney, lower quartile houses rose 0.8% while upper quartile fell -0.9%. Competition for affordable stock remains fierce, especially in Melbourne’s west.
Rental growth accelerates
National rents rose 0.7% in February, the strongest monthly increase since April 2025, with annual growth hitting 5.5%, the fastest pace since October 2024.
Melbourne’s west leads national investor research
February’s headline was clear: Melbourne recorded 0.0% growth. But that number masks what’s actually happening on the ground, and more importantly, where professional investors are deploying capital.
According to HTAG’s February Suburb Popularity Report, which tracks professional investor research across 758 suburbs nationally, Melbourne’s western growth corridor commands 9.0% of all national research activity, the highest allocation of any region in Australia. Across 44 suburbs, Werribee, Point Cook, Williams Landing, Hoppers Crossing, and Brookfield continue to attract intense professional scrutiny. Werribee alone has delivered 141% total growth over 10 years (9.2% annualized) and added 7.7% in the past year despite the broader market slowdown.
This isn’t nostalgia or misplaced optimism. It’s data-driven conviction. The west’s infrastructure pipeline (Sneydes Road upgrade, Western Rail extension), employment anchors (Pacific Werribee, major logistics hubs), and sub-$800k pricing with strong rental demand continue to underpin its appeal. The 0.0% headline reflects macro headwinds hitting all major capitals, not a fundamental breakdown in Melbourne’s growth corridors.
The key insight: professional investors are separating Melbourne’s established inner and middle-ring suburbs (which are stalling under serviceability pressures) from the affordable outer growth areas where first home buyers, upgraders, and investors are still competing. The latter is where the action remains.
Perth sprints, but supply realities will moderate
Perth’s 2.3% monthly surge and 22.0% annual growth is undeniably the standout performance. With listings 48% below the five-year average, supply is so constrained that even modest demand drives sharp price increases. Brisbane (listings down 31%) and Adelaide (down 23%) are experiencing similar dynamics.
But here’s the nuance the headlines miss: Sydney and Melbourne’s listing levels are only 1.0% and 4.3% below their five-year averages respectively. More significantly, fresh listings in both cities surged in February. Sydney up 9.7% above average, Melbourne up nearly 12%. Vendors are clearly motivated, likely trying to beat further softening. This dynamic creates opportunity: motivated sellers meeting patient buyers with financing in place can still negotiate favorable entry points, particularly in Melbourne’s growth corridors where the long-term fundamentals remain intact.
In contrast, try negotiating in Perth right now. The supply crisis is so acute that buyers are competing in a seller’s market with minimal leverage.
Lower quartile strength across all capitals, including Melbourne
The data is unambiguous: lower-priced properties are still seeing competition while the top end stalls. In Sydney, lower quartile house values rose 0.8% in February while upper quartile houses fell -0.9%. The same pattern plays out in Melbourne, Brisbane, Adelaide, and Perth. First home buyers, investors, and upgraders are all competing for affordable stock, while serviceability constraints choke off demand at higher price points.
The HTAG data reinforces this. Of the 758 suburbs under active professional research in February, 55% sit in IRSAD socio-economic deciles 1 to 4 (working and middle-class areas), with an average house price of just $746,000. Professional investors are overwhelmingly targeting affordability, and the strategy is working. Lower IRSAD suburbs delivered 11.5% one-year growth on average versus just 4.1% for the most affluent areas.
Melbourne’s western corridor sits squarely in this sweet spot: Werribee (IRSAD decile 5, $773k median), Hoppers Crossing (decile 4, $776k), and Point Cook (decile 9 but still sub-$900k) all combine affordability with proven long-term track records. Werribee and Point Cook have each delivered over 140% total growth over the past decade. Consistent compounding through multiple market cycles.
Regional Victoria rises, but Melbourne’s corridors hold their own
Victoria claimed 18 of the Top 20 most-researched suburbs nationally in February, with regional towns taking half the positions: Alfredton (#1), Mildura (#2), Golden Square (#3), plus Warrnambool, Hamilton, Traralgon, Lara, and Belmont. These regional centres offer lower entry prices ($425k to $730k) and higher gross yields (3.7% to 4.7%).
But Melbourne’s established growth corridors aren’t being abandoned. They’re holding their ground. Werribee, Point Cook, Williams Landing, and Hoppers Crossing all remained in the top tier of research activity. The difference is strategy: regional Victoria appeals to cashflow-focused investors willing to accept slower transaction times (47 days on market on average) and smaller buyer pools. Melbourne’s west appeals to growth-focused investors prioritizing infrastructure, employment density, and liquidity (41 days on market, comparable to the national average).
Both strategies have merit. Regional Victoria delivers higher yields today. Melbourne’s west delivers deeper markets, faster transactions, and infrastructure-driven upside tomorrow. The February data shows professionals are pursuing both simultaneously, not choosing one over the other.
Rents accelerate, yields stay compressed
National rents rose 0.7% in February, the strongest monthly increase since April 2025, with annual growth hitting 5.5%, the fastest pace since October 2024. Darwin led with 8.6% annual growth, while Adelaide’s rental growth has actually eased to 3.2%, the second-lowest of any capital after Canberra’s 2.9%.
Melbourne’s rental market remains tight despite the flat price growth, with vacancy still well below long-term averages. The western growth corridor in particular continues to see strong rental demand driven by affordability-constrained renters priced out of inner and middle-ring suburbs. This rental floor provides downside protection even as capital growth pauses.
Gross rental yields across capitals sit at 3.4%, compressed, but Melbourne’s outer growth areas still deliver yields in the 3.5% to 3.8% range with significantly more liquidity than regional alternatives.
The HTAG data reveals an important yield dynamic over three years: some markets have seen rents outpace prices (yield expansion), while others have seen prices run ahead (yield compression). Melbourne’s western suburbs have generally maintained stable yield relationships. Not the explosive expansion seen in regional Victoria’s Hamilton (+12.8%) or Warrnambool (+15.9%), but also avoiding the severe compression evident in markets like Dubbo (-9.2%) or Mount Louisa (-7.4%). This stability matters for investors modeling cashflow sustainability.
Things To Keep An Eye On
Melbourne’s vendor motivation creates opportunity
Fresh listings running 12% above the five-year average means patient buyers with pre-approval can negotiate from a position of strength.
Infrastructure pipeline remains intact
The western growth corridor’s major projects (Sneydes Road, Western Rail, employment precincts) continue regardless of short-term price movements.
Supply will eventually lift
Building approvals and commencements are rising in WA, SA, and QLD. When Melbourne’s cycle turns, supply constraints will likely drive the next leg up.


