Market Trends
March 2026 Market Smart:
Why Smart Buyers Are Moving While Everyone Else Is Waiting
Global uncertainty is reshaping the Australian property market in real time, and for prepared buyers, that spells opportunity. With motivated sellers returning to the table in key markets, professional investor research hitting record volumes nationally, and Melbourne’s growth corridors delivering some of the strongest risk-adjusted fundamentals in the country, April 2026 marks one of the most favourable entry conditions for buyers we have seen since 2022.
Key Market Movements
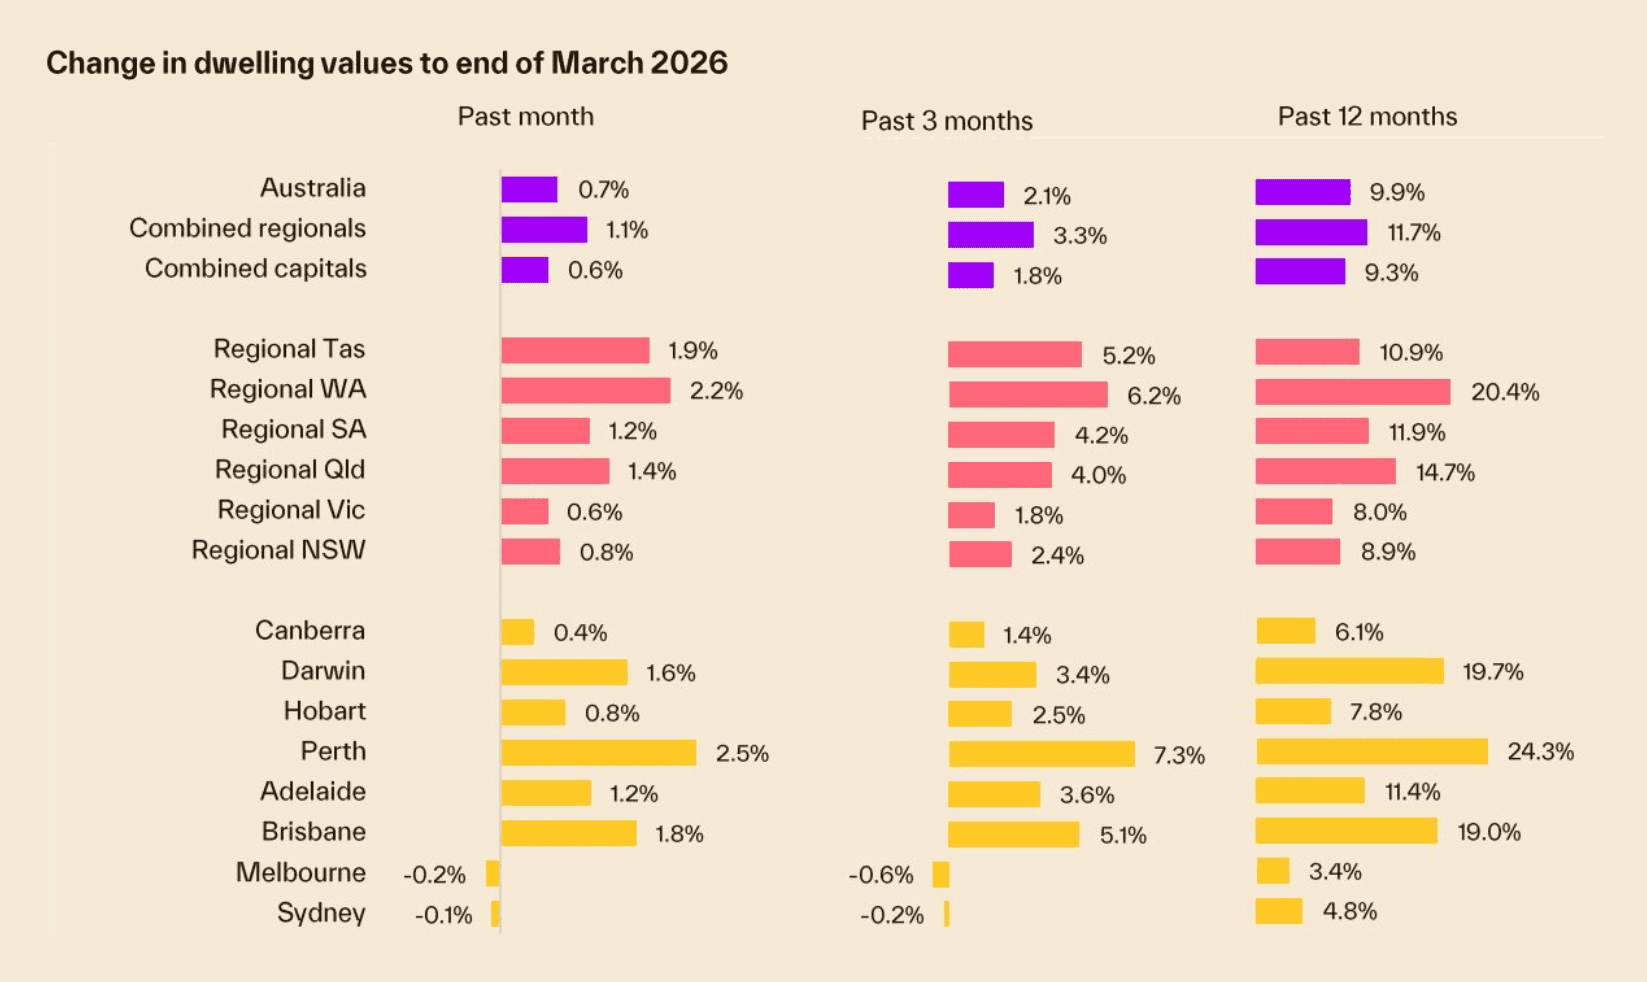
The Cotality Home Value Index for March 2026 confirms what we have been seeing on the ground. Nationally – values rose 0.7% for the month and 9.9% over the past year. But the city-by-city story is where it gets interesting, and the divergence between markets is creating very different conditions for buyers depending on where they are looking.
At the top of the ledger, Perth surged 2.5% in March alone and is now up 24.3% over the past year. Brisbane delivered 1.8% for the month and 19.0% annually. Darwin and Adelaide are both running hot, up 19.7% and 11.4% respectively over twelve months. These mid-sized capitals continue to break record highs and are attracting significant attention from professional investors chasing momentum and yield.
Melbourne is navigating a mild correction from its 2022 peak and is down 1.3% from that high point. Victorian auction clearance rates came in at 55% for the week ending 29 March. Advertised stock is rising and days on market are extending. Sellers who were untouchable six months ago are back at the negotiating table. For buyers, this is the window. The mild softness in headline values has improved the yield profile for buyers entering now, and Melbourne’s growth corridors are drawing the strongest professional research interest of any market in the country.
The divergence within markets is the most important detail for investors to understand. Across every capital, lower quartile values are outperforming. Working and middle-class suburbs are where demand is concentrating, driven by affordability constraints deflecting buyers from premium price points, first home buyer stimulus, and elevated investor activity chasing yield. This is precisely where the professional research data is most concentrated.
Melbourne’s median house sits at $982,876 and the median unit at $644,074, making it significantly more accessible than other east coast capitals. Units across Melbourne are delivering gross yields of 4.9%, among the strongest of any major capital city, and the mild price softening has only improved that entry point further. The standout Melbourne growth suburbs over the past 12 months were Frankston at 11.3%, Keilor at 9.5%, and Sunbury at 9.0%.
Nationally, regional markets are showing strong resilience. Combined regional values rose 1.1% for the month and 3.3% for the quarter, outpacing the combined capitals at 0.6% and 1.8% respectively. Regional WA is the standout, up 6.2% for the quarter, with Bunbury up 8.4% for the quarter and 22.2% for the year.
Interest Rate Environment
The RBA has delivered two consecutive hikes in 2026, pushing the current cash rate to 4.10%. A May hike is now consensus across all four major banks, taking the rate to 4.35%. Westpac has gone further, forecasting three additional hikes through to August, which would take the cash rate to 4.85%, a level not seen since the GFC in 2008. The driver is the Middle East conflict and its sustained disruption to global fuel supply, feeding through to broader inflation faster than the RBA anticipated.
Here is the counterintuitive truth: this is precisely why the opportunity exists right now. The rate uncertainty that is keeping cautious buyers on the sidelines is the same force that is softening seller expectations, slowing competition at auction, and giving prepared buyers negotiating leverage they have not had in years. Those who wait for rate certainty will wait until the market has already repriced upward.
For buyers with pre-approval in place, the serviceability hurdle is real but manageable. On a $600,000 loan, two hikes this year have added $181 per month in repayments. On a $1 million loan, Westpac’s five-hike scenario would add approximately $5,466 in repayments across 2026. Pre-approval is essential and cashflow modelling at current rates, not hoped-for future rates, is non-negotiable.
What Professional Investors Are Doing
Right Now
What Professional Investors Are Doing Right Now
While sentiment surveys show cautious consumers, professional investor behaviour tells a very different story.
HtAG Analytics, which tracks suburb-level research activity across thousands of professional investors and buyers agents nationally, recorded 830 suburbs under active investigation in March, a new record and 9.5% above February. This is 41% above the September baseline. Professional investors are not sitting on their hands. They are expanding their research footprint at the fastest pace in seven months.
Melbourne dominates that activity. Victoria commands 43.4% of all national professional research downloads, with 275 suburbs under active investigation. That is the single largest state allocation by a significant margin, more than double Queensland’s share and more than two and a half times NSW. Despite the mild headline correction, professional capital is not rotating away from Melbourne. It is concentrating into Melbourne’s highest-conviction growth corridors.
The Top 20 most-researched suburbs nationally confirms this. Victoria holds 14 of 20 spots. Craigieburn surged to number two nationally with an overall Relative Composite Score of 90, reflecting broad-based fundamentals across capital growth, cashflow, and lower risk metrics simultaneously. Point Cook sits at number three, Werribee at number four, Williams Landing at number five. Frankston, Sunbury, Grovedale, Bell Park, Brookfield, and Hoppers Crossing all hold Top 20 positions. Werribee’s ten-year total growth of 140.4% is the standout long-term compounding track record in the entire national dataset.
The broader national picture is also shifting. WA doubled its professional research share to 6.3% in March, its strongest month on record, with Perth suburbs posting 15 to 24% one-year growth at $700,000 to $950,000 price points. South Australia matched that at 6.3%, also a record. Tasmania has now consolidated above 6% share for five consecutive months, with Claremont and South Launceston both cracking the national Top 20 for the first time, offering sub-$620,000 entry points, yields above 4.2%, and decade-long total growth above 119%.
The average Top 20 suburb has a typical price of $730,000, 37 years to own on an affordability measure, and has delivered 105.7% total growth over ten years. Professionals are buying where the numbers work, not where the postcodes sound impressive.
Suburb Spotlight
Three markets where the opportunity is most pronounced right now:
- Craigieburn, ranked number two in national professional research with a median of $758,000, 9.4% one-year growth, 115.8% ten-year total return, and a gross yield of 3.5%. The fundamentals are broad-based across capital growth, cashflow, and risk metrics simultaneously. This is Melbourne’s northern growth corridor at its most convincing, and the data confirms it is drawing the strongest professional interest of any Melbourne suburb right now.
- Frankston and the Mornington Peninsula corridor, up 11.3% over the past year with a median of $851,755. Melbourne’s strongest performing suburb over the past twelve months, supported by lifestyle demand, relative affordability, and ongoing infrastructure investment. Competition has eased from the peak, creating genuine room to negotiate.
- Werribee and the western corridor, delivering 140.4% ten-year total growth, the best long-term compounding track record in the national Top 20. At a median of $753,000, this remains one of the most accessible entry points in metropolitan Melbourne with a decade of data confirming structural, sustained growth.
For investors considering a broader national strategy, HtAG data flags Tasmania as worth serious attention alongside the well-documented WA story. Seven consecutive months of professional research consolidation in Tasmania, with sub-$620,000 entry points and yields consistently above 4%, represent the kind of structural, data-confirmed opportunity that rarely stays quiet for long.
Investment Implications
Geopolitical uncertainty is uncomfortable. It is also, historically, one of the most reliable generators of buying opportunity in property markets. Sentiment-driven softness rarely lasts, and the structural fundamentals that underpin long-term property value have not changed. Population growth, infrastructure pipelines, and chronic undersupply remain firmly intact across the markets where professional capital is concentrating.
The professional investor data reinforces this directly. Record research volumes in March, with Melbourne’s growth corridors commanding the lion’s share of national attention, are not the behaviours of a market in retreat. They are the behaviours of sophisticated capital recalibrating toward value and positioning ahead of the sentiment recovery. Informed buyers are moving now. They will not be announcing it when they do.
The buyers who will look back on 2026 as their best decision will be the ones who used the noise to negotiate, not the ones who waited for it to clear. Rising listings, softening clearance rates in key markets, and motivated sellers are the conditions that allow buyers agents to do their best work.
Three practical steps for buyers right now:
- Get pre-approval sorted at current rates.
- Identify your target market and price band before the next RBA decision.
- Move on well-located property without waiting for a bottom that will not announce itself.
Next Month Outlook
The RBA May meeting on 5 May is the single most important event to watch. If the board delivers the widely expected 0.25% hike to 4.35%, expect a short-term dip in sentiment followed by stabilisation as the market adjusts. Watch Victorian auction clearance rates in the weeks following the decision. If they hold above 50% through mid-May, demand in the growth corridors has not broken and the current softness is a window, not a structural decline.
Any signal from the RBA that May is the last hike in this cycle would likely trigger a sharp uptick in buyer activity within weeks, with Melbourne’s growth corridors, already the most heavily researched markets in the country, among the first to respond.
On the research side, watch whether WA and SA maintain their March momentum in April’s HtAG data. Two consecutive months of record professional research share for both states would confirm a structural reallocation rather than a one-month anomaly, and would add further weight to the Cotality data already showing Perth up 24.3% and regional WA up 20.4% annually.
Data sourced from Cotality Home Value Index March 2026, REA Group auction data week ending 29 March 2026, Westpac Economics March 2026, and HtAG Analytics March 2026 Suburb Research Report. Analysis by Julian Khursigara, Search Party Property.