Market Trends
September 2026 Market Smart:
Spring delivers buyers more choice as values slip for a sixth month
Spring arrived in September, but the property market stayed in a cooler mood. Cotality’s national Home Value Index fell 1.1% over the month, the sixth decline in a row, leaving values 5.2% below their March peak. Every capital except Darwin recorded a fall, and a fourth rate hike from the RBA late in the month added another layer of caution.
For investors with a long-term view, this is the kind of market that rewards preparation. Stock levels are up, homes are taking longer to sell, competition at auction is thin and gross rental yields have climbed to their highest level since 2019. Buyers are firmly back in the driver’s seat. Here’s what moved in September and what it could mean for your next move.

Key Take Aways
Rates hit a 15-year high
The RBA lifted the cash rate to 4.60% on 29 September, its fourth hike this year and the highest setting since late 2011.
Inflation heads the wrong way
Annual CPI rose to 4.0% in August, up from 3.5% in July, while trimmed mean inflation held steady at 3.6%
Auctions stuck below 50%
Clearance rates have now sat below 50% in 15 of the past 17 weeks, and Brisbane has stayed under 40% for 17 weeks running.
Homes taking longer to sell
Capital city homes are taking a median of 39 days to sell, up from 23 a year ago, giving buyers more time and room to negotiate.
Yields keep repairing
National gross rental yields rose to 3.85%, the highest since August 2019, as rents keep rising while values ease.
Victoria dominates research
Victoria accounted for 51.2% of national property research on HtAG in September, with Sunbury the most-researched suburb in the country
What’s moving and what isn’t
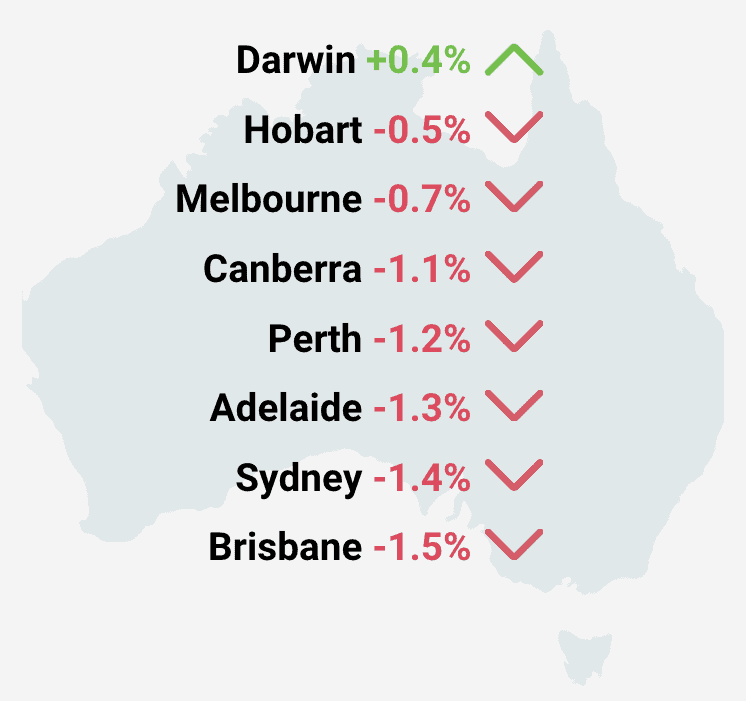
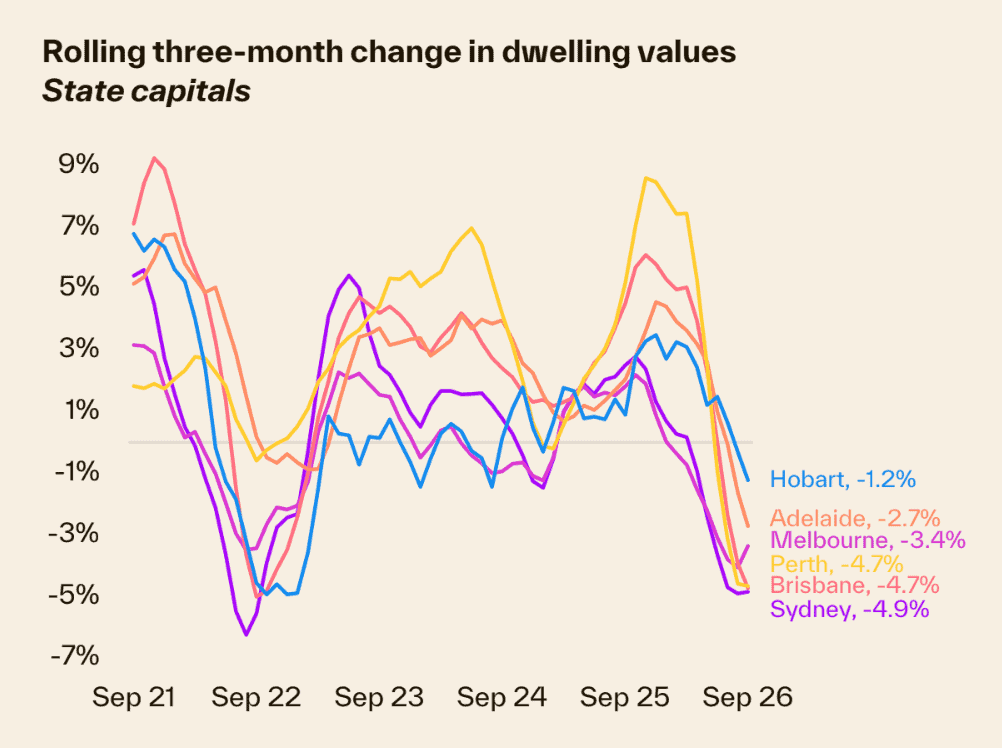
Brisbane recorded the steepest monthly fall of the capitals, down 1.5%, edging past Sydney at -1.4%. It’s a sharp turnaround for a city that led the nation for much of the past two years, although Brisbane values are still 5.9% higher than a year ago. Adelaide (-1.3%), Perth (-1.2%) and Canberra (-1.1%) also slipped by more than 1%.
Sydney is now 8.6% below its February peak, while Melbourne’s decline has eased to -0.7%, the mildest result among the larger capitals. Darwin was the standout, the only capital to rise (+0.4%), and it also leads annual growth at 11.9%, ahead of Perth on 10.1%.
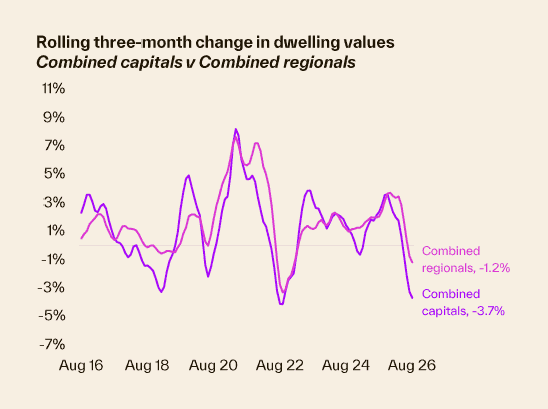
Regional markets continue to hold up better. Regional values fell 0.7% in September but remain 5.6% higher over the year, compared with a 1.8% annual decline across the combined capitals.
Cotality 2026
How buyers and sellers are feeling now
Confidence took a knock in September. The Westpac–Melbourne Institute Consumer Sentiment Index fell 5.2% to 84.4, as higher fuel prices and concerns about further rate hikes weighed on households. That caution is showing up in activity. Home sales over the past three months are tracking 19.1% below a year ago, with Brisbane (-27.2%), Sydney (-26.5%) and Perth (-24.2%) seeing the biggest drops.
Auction clearance rates lifted to a 19-week high of 52.6% mid-month before slipping back to 49.1%, well short of the 71.6% recorded in the same week last year. Fewer new listings are coming to market, yet total capital city stock is up 23.1% on last year and homes are taking a median of 39 days to sell, up from 23.
For sellers, realistic pricing is now essential. For buyers, it means more choice, more time and more room to negotiate.
Rent growth cools as yields climb to a seven-year high
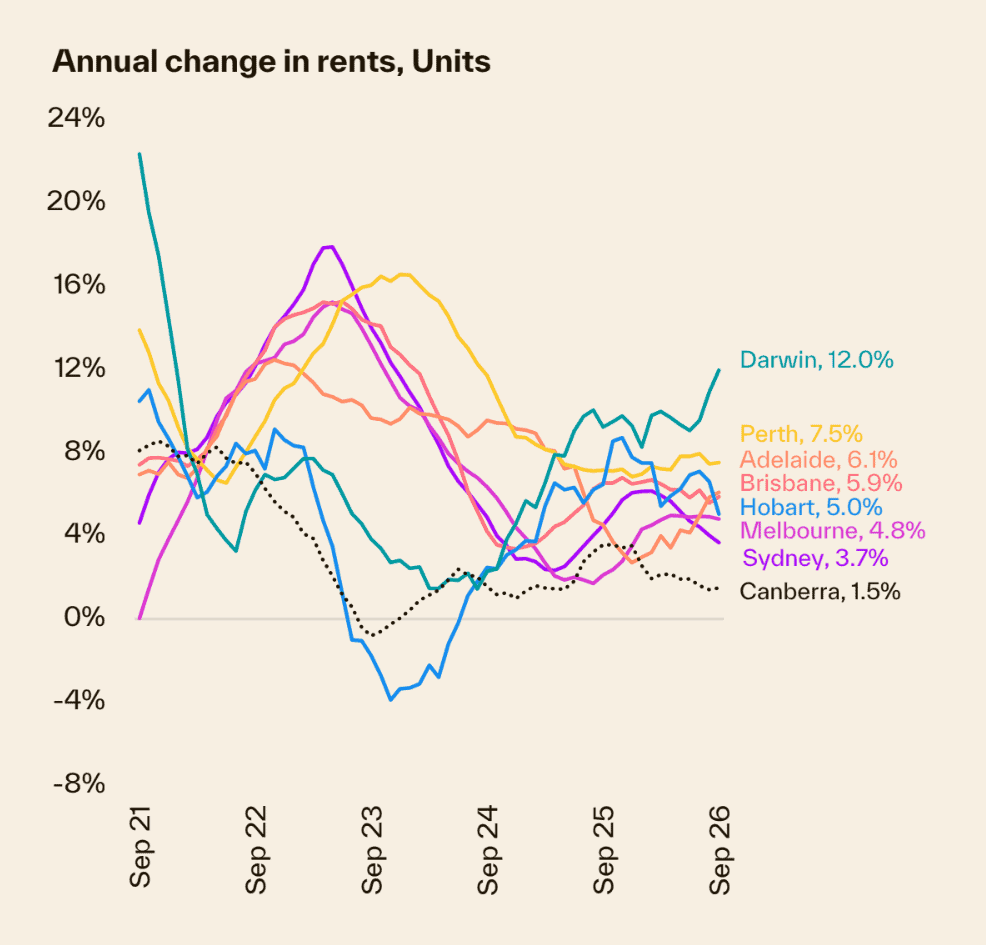
Rental conditions are starting to ease. The national vacancy rate rose to 2.0% in September, up from a record low of 1.5% in February, though still well below the pre-COVID decade average of 3.3%. Hobart has the highest vacancy rate of the capitals at 3.0%, followed by Sydney (2.3%), then Brisbane and Perth (2.1%), while Adelaide remains the tightest at just 1.4%.
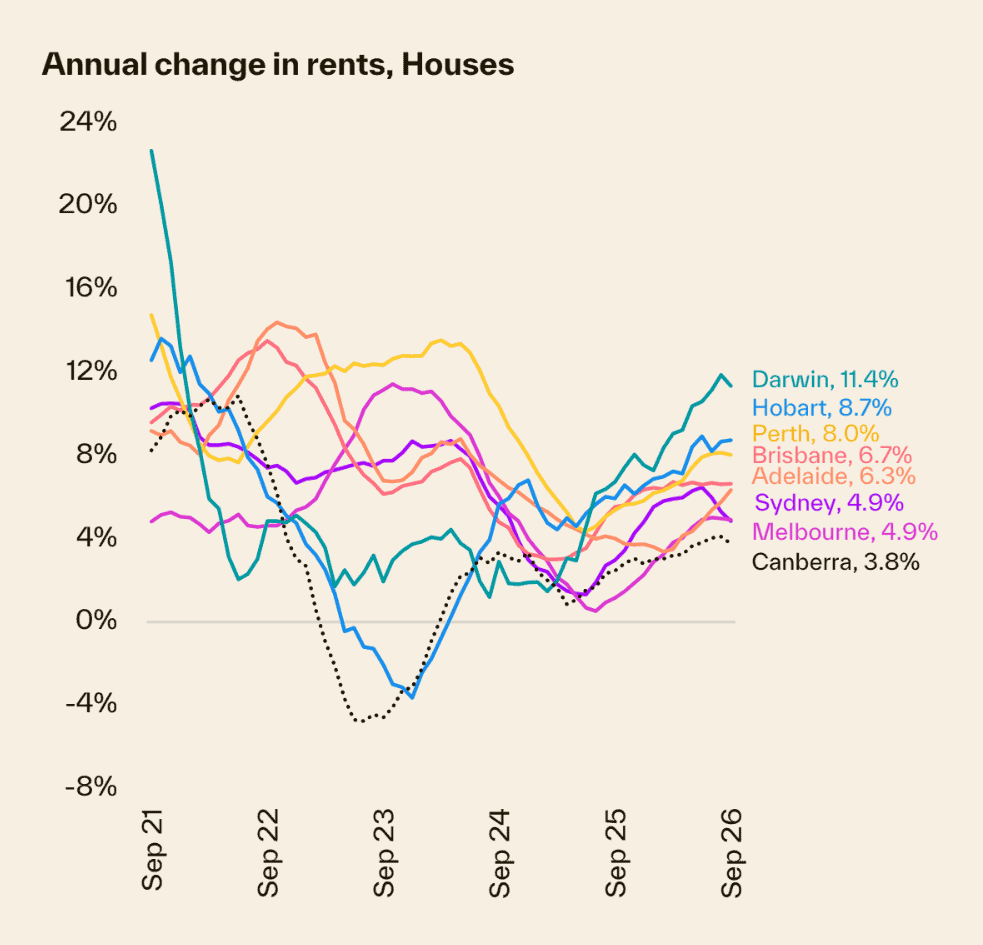
Monthly rent growth slowed to 0.3%, the smallest rise since May 2025, taking annual growth to 5.5%. Darwin continues to lead the way, with house rents up 11.4% and unit rents up 12.0% over the year.
The upside for investors is yield. With rents still rising and values easing, national gross yields have lifted to 3.85%, the highest since August 2019, ranging from 3.4% in Sydney to 6.5% in Darwin.
Cotality 2026
What the fourth RBA hike means for investors
On 29 September, the Reserve Bank lifted the cash rate by 25 basis points to 4.60%. It was a unanimous decision, the fourth hike of 2026, and takes the cash rate to its highest level since November 2011.
The move was widely expected. Inflation data for July ran hotter than the RBA had anticipated, and the bank had signalled it would act if upside risks materialised. The August CPI, released the following day, showed annual inflation rising to 4.0%, up from 3.5% in July.
Higher rates reduce borrowing capacity and narrow the pool of buyers who can qualify for a loan, which is a big part of why competition has thinned. For well-prepared investors with finance in place, that’s an opening. Fewer active buyers means more negotiating power, and buying when sentiment is weak has often allowed investors to secure better entry prices.
Things to keep an eye on
Another rate rise in November? The RBA has left the door open. ANZ, the most hawkish of the big four, has been forecasting a further hike in November that would take the cash rate to 4.85% by year-end. The September inflation figures, due in late October, will be the key signal.
How much stock builds through spring. New listings are actually running below last year, but because homes are selling more slowly, total inventory keeps climbing. If spring brings a wave of fresh listings without a matching lift in demand, buyers will have even more choice and leverage heading into summer.
The investor response to tax changes. The Federal Budget changes to negative gearing and capital gains tax have already seen a sharp pullback in investor demand for established homes. Watch how this plays out over coming months, particularly in investor-heavy markets and higher price points.
Where the research is heading. HtAG’s September index shows Victoria taking 51.2% of national property research, its highest share since October 2025, while Queensland fell to a series low of 15.4%, slipping behind NSW. Sunbury was the most-researched suburb, and three inner-Melbourne suburbs entered the Top 20. Western Australia also placed two suburbs in the Top 20, Alkimos and Mandurah. It was a lighter month for research volume, so October will show whether these shifts stick.
The factors limiting the downside. A reasonably tight labour market and persistently low levels of new housing supply should help contain the downturn. Cotality expects a gradual drift lower in values rather than a sharp correction, which gives patient, well-researched investors a window to act while competition is light.