- The first step is making the call.
- 1300 022 482
- hello@searchpartyproperty.com.au

28th February 2023 – Property Market Update

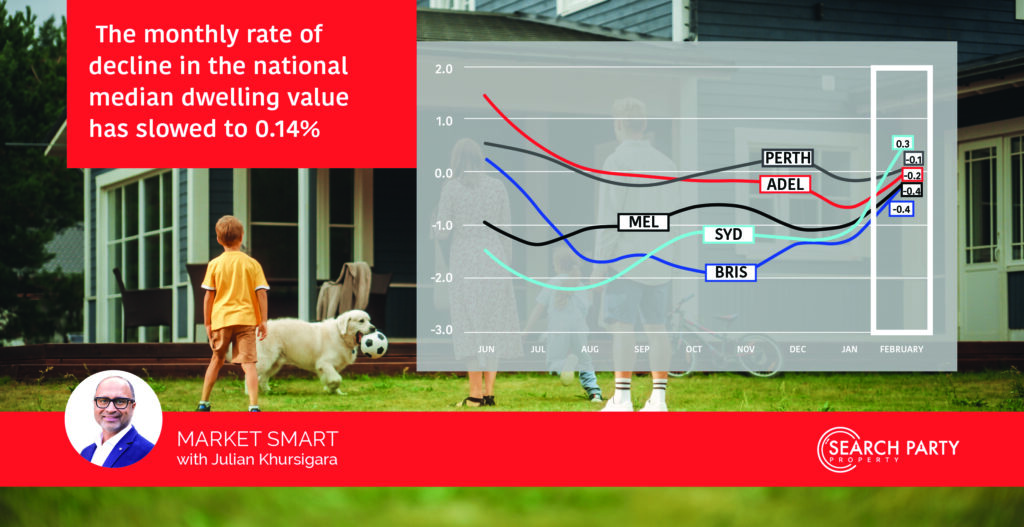
In somewhat surprising news, the monthly rate of decline in the national median dwelling value has slowed significantly, to 0.14%. This is largely due to an upswing in the Sydney market, which saw the city’s median price increase 0.3%. That said, almost all capital and regional markets saw a slowing of their rate of decline over the last month.
On the rental side, there has been a notable splintering of market performance based on location and property type. While units continue to perform strongly in the biggest cities, most house and regional rental markets appear to be cooling. However, as vacancy rates are still at near record lows, rents are expected to continue rising over the coming months.
7 Charts that Sum Up the State of the Property Market
1. Change in Dwelling Values
Key points to note:
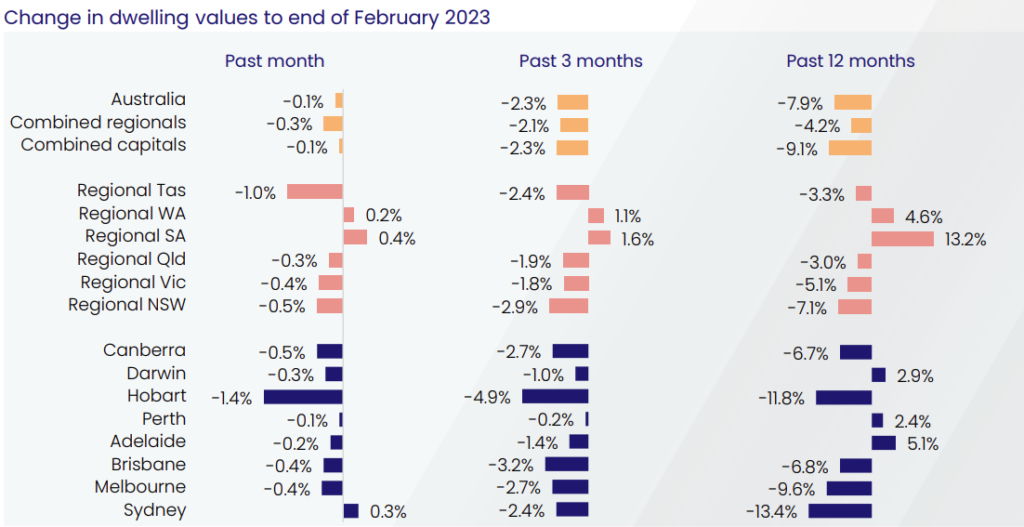
- After falling 1.0% in January, the national median dwelling value dropped only a further 0.14% over the last month. This represents a significant slowing of the monthly rate of decline in property prices, at least at the national level.
- Sydney recorded positive monthly growth (up 0.3%) for the first time since January 2022. However, its median dwelling price remains 13.4% below what it was 12 months ago – the largest loss of any major market.
- Regional South Australia continues to be the strongest performing market, with the median dwelling value up a further 0.4% in February. However, the rate of increase is slowing, with the quarterly growth rate slipping from 2.3% to 1.6% over the last month.
2. Weekly Auction Clearance Rates
Key points to note:
- Across the capitals, auction clearance rates have steadily increased since the start of the year. After averaging 55.1% for the final weeks of 2022, they have risen to an average of 65.8% for February.
- In Sydney, a weekly clearance rate of above 70% was recorded for the first time since February 2022. Melbourne also saw weekly clearance rates rise above 70%, which was the first time since April 2022.
- While clearance rates are trending upwards, the number of auctions being conducted remains relatively low. During February, weekly auction volumes were as much as 31.2% lower than at the same time last year.
3. Change in Sales Volumes
Key points to note:
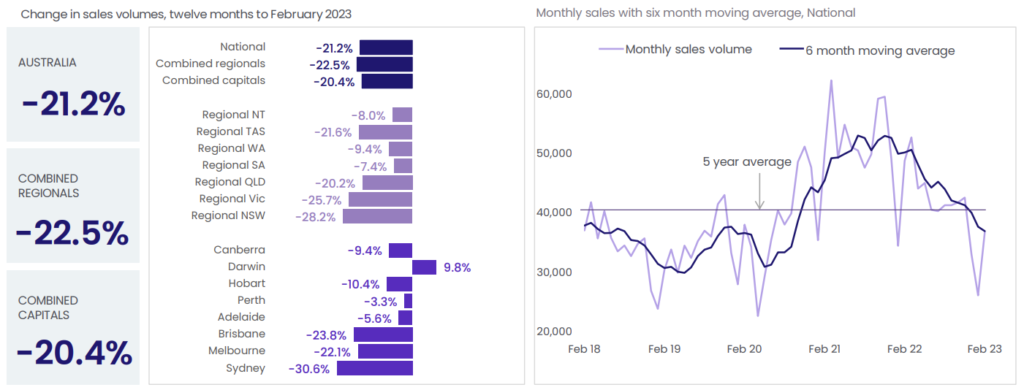
- Total sales volumes also continue to track lower than in recent years, reflecting the ongoing slowing of buyer demand. At the national level, 21.2% fewer properties were sold over the last 12 months, than over the previous 12 months.
- Sydney has seen the sharpest drop, with annual sales volumes down 30.6% on last year. New South Wales is also the regional market that has recorded the largest fall in buyer activity (down 28.2%).
- Darwin is the clear anomaly to the trend of declining sales, with annual volumes up 9.8% on last year. However, this is mostly due to the comparative slowness of the market over the previous 12 months.
4. Change in Listings Volumes
Key points to note:
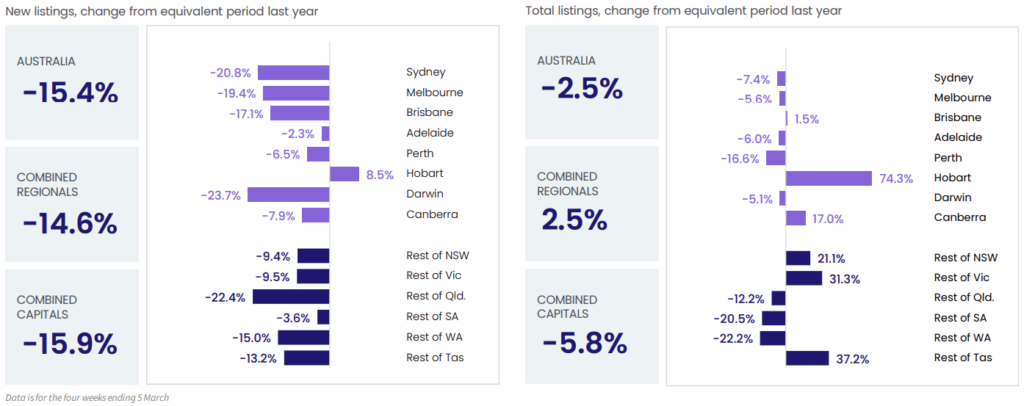
- The majority of major markets continue to see significant supply issues, with new listings down 15.4% on last year. At the national level, new listings are also 12.7% below the 5-year average.
- While new listings remain limited, a seasonal lift has brought them closer to last year’s levels and the 5-year average. This is largely being driven by increased supply in Canberra, Hobart, and several regional markets.
- Total listing levels are more varied compared to 12 months ago, with several markets seeing more available stock. That said, while nationally, total listings are down 2.5% on last year, they are well below (26.1%) the 5-year average.
5. Quarterly Median Vendor Discount
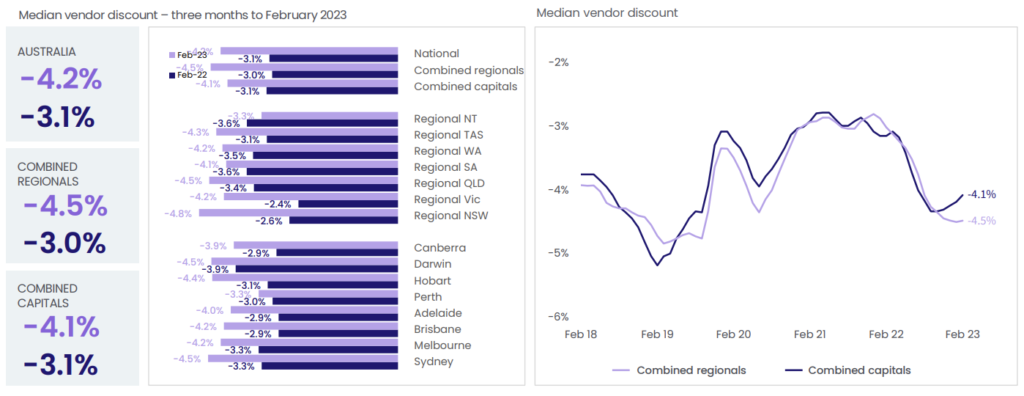
Key points to note:
- At the national level, the median vendor discount is 1.1% more than it was 12 months ago. This reflects the slowing of the market, and the extra flexibility sellers need to show to secure a buyer.
- Regional NSW has seen the biggest increase, with the median vendor discount now 2.2% higher than this time last year. However, it is important to note that, 12 months ago, Regional NSW had the second lowest vendor discount rate (behind Regional Victoria).
- While vendor discounts have grown over the last 12 months, median rates have dropped slightly over the last month. This is consistent with the stabilising of property prices and reflects the ongoing supply limitations and rising auction clearance rates.
6. Change in Median Rents
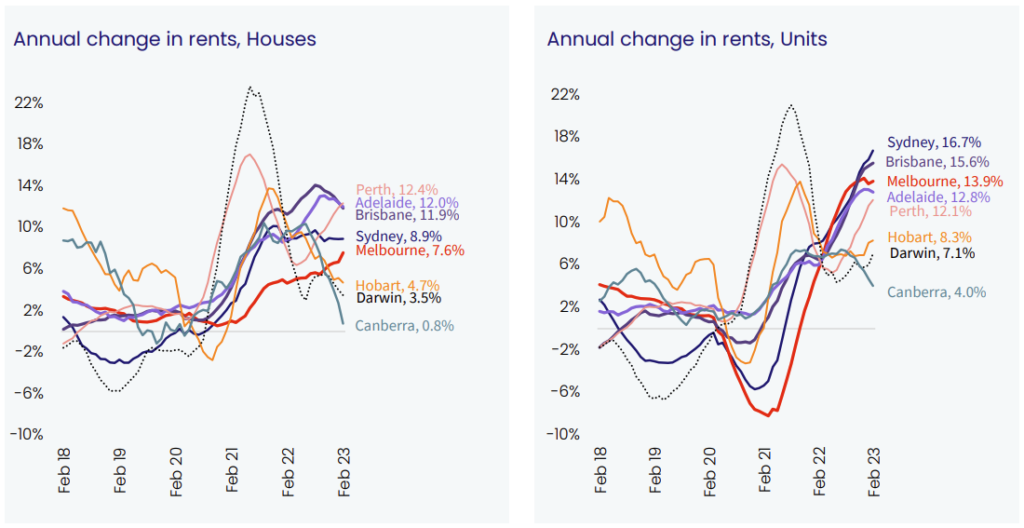
Key points to note:
- The national annual rent growth rate has held steady at 10.1%, only slightly down on December’s record high of 10.2%. This is largely being driven by the near record low vacancy rates being seen in most areas.
- While all market segments have seen rents increase over the last year, units are performing particularly well. This is especially true in the three largest capitals – Sydney (up 16.7%), Brisbane (up 15.6%), and Melbourne (up 13.9%).
- Houses are performing more modestly, with an annual growth rate notably lower than for units in most locations. Most experts believe this is due to affordability concerns and that it suggests renters have reached a price ceiling for houses.
7. Interest Rate Tightening Cycles Since 1990
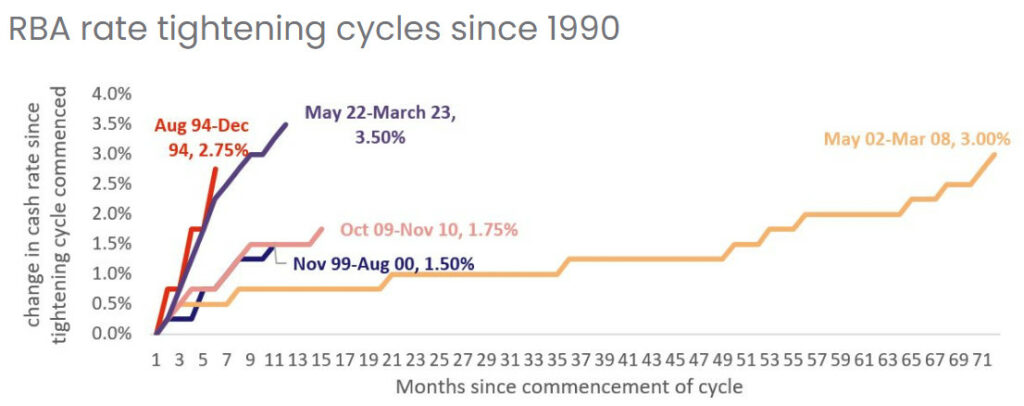
Key points to note:
- Since the latest round of rate rises began, there have been 10 consecutive increases to the cash rate. Individual increases have ranged from 25 basis points (0.25%) to 50 basis points (0.50%).
- Over this period, the cash rate has lifted 3.50%, from a record low of 0.1% to 3.60%. This is the highest it has been in over a decade (since May 2012).
- The current rate hiking cycle is now easily the largest and fastest on record – and further increases are expected.
3 Trends We Are Watching
1. Interest rates
At their March meeting, the Reserve Bank decided to raise the cash rate a further 0.25%. As noted above, this is the tenth consecutive increase and brings the cash rate to 3.60%, the highest level since May 2012.
While the latest increase was largely expected, there is growing criticism of the RBA’s sustained commitment to rate rises. Most notably, there is widespread concern about the significant impact ongoing increases are having on the average Australian household. This is only likely to increase over the coming months, as more mortgage holders end their fixed-rate periods.
Many experts have also begun questioning the logic driving the RBA’s decision making. While previous increases have been designed to help curb inflation, many of the key economic indicators suggest this pressure is easing. In fact, in recent announcements, even the RBA itself acknowledged that growth and inflation are slowing faster than they expected.
Acknowledging this, there has been a clear softening in the RBA’s language regarding the potential for further rate increases. While they have stopped short of committing to pausing future rises, they have definitely left the door open.
That said, most financial experts, including the major banks, expect the cash rate to peak closer to 4%. This means that they believe there will be one or more additional rate rises announced over the coming months. However, the exact number, size, and timing of any further increases remain the subject of much debate.
2.The “fixed-rate cliff”
Despite the sharp increase in interest rates, to date, property data is showing minimal signs of mortgage distress. Most experts believe this is because fixed-rate loans have insulated many borrowers against the impacts of the recent rises. However, this could soon change, with 23% of mortgages due to move from fixed to variable over the coming months.
This means that almost a quarter of mortgage holders will suddenly see their interest rate increase by 3.5% or more. With the average mortgage currently sitting at just under $540,000, this equates to an increase of over $1,000 in monthly repayments. For those already struggling to meet the rising cost of living, this will be a major hit.
However, it is important to note here that just under 70% of all active mortgages are already on variable rates. This means that the majority of homeowners and investors have already felt the impact of the recent rate hikes. The fact that this has not led to a flood of distressed sales suggests that the market is reasonably resilient.
It is also worth noting that widespread repayment defaulting is not an outcome anyone wants – least of all mortgage providers. As such, if mortgage distress levels start to increase, we are likely to see a range of temporary forbearance measures. For example, the extended repayment terms and “repayment holidays” made available at the start of the pandemic could see a return.
All that being said, the next few months are sure to be challenging for many mortgage holders. This could lead to some difficult decisions needing to be made, which could have a major impact on the market.
3. Listing levels
Many property market experts were caught slightly off guard by the latest monthly growth numbers. While most expected the rate of decline to continue slowing, the near stabilisation of the national market was surprising. As always, this was due to a range of factors, however, most commentators are focusing on one key element – supply.
Since September 2022, most locations have seen new listing levels consistently track below the 5-year average. This has helped offset falling buyer demand and maintain a sense of competition for quality properties. As a result, it has also helped slow the rate of decline in property prices and protect dwelling values.
However, it is not clear how long this will last, with listing levels seeing a seasonal lift over the last month. Increasing mortgage pressures could also see a flow of new listings from distressed, or at least highly motivated, sellers. This could easily disrupt the current balance of the market and reaccelerate the decline in property values.
At Search Party Property, we specialise in developing tailored investment strategies and will work with you to come up with a suitable plan of attack. We also regularly assess your strategy ensuring that it is fit for purpose and delivering the desired results.


