- The first step is making the call.
- 1300 022 482
- hello@searchpartyproperty.com.au

As of 30th September 2022 – Property Market Update


In somewhat surprising news, the rate of decline in Australian property values has slowed for the first time in months. After dropping 1.6% in August, the national median dwelling value fell a slightly more modest 1.4% over September. This was driven by slowing declines in most markets, with only Adelaide and Perth seeing accelerating value losses.
It is the opposite story for the rental market, with the national median rent rising by 0.6% over the month. This is the lowest monthly increase since December 2021 and well down from the cyclical peak of 1.0% seen in May. While the slowing growth in rents is consistent across most markets, it has been particularly pronounced in regional areas.
7 Charts that Sum Up the State of the Property Market
1. Change in Dwelling Values
Key points to note:
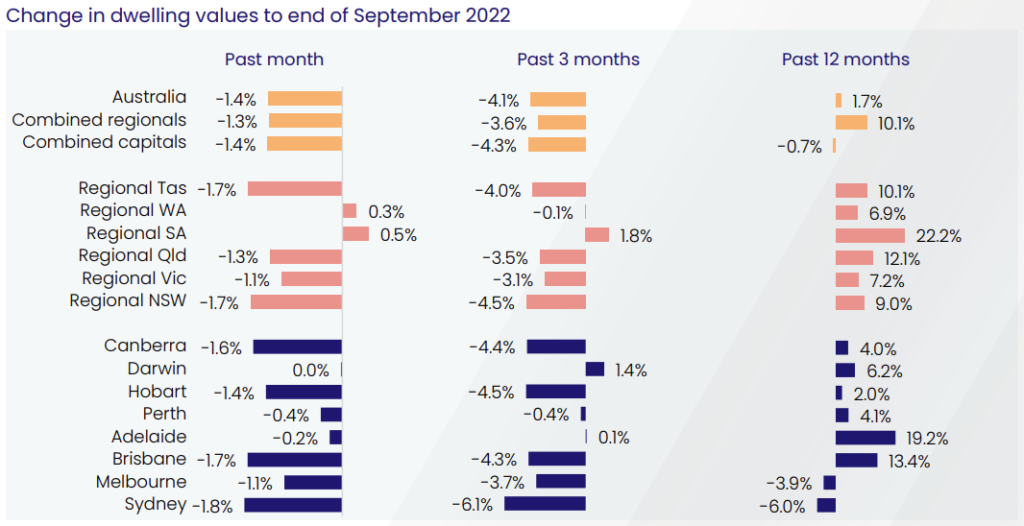
- The median national dwelling value fell by 1.4% over September, which is slightly better than the 1.6% decline seen in August. Values have fallen 4.1% over the last three months, which is the largest quarterly drop in value since the 1980s.
- Despite being a standout only a few months ago, Brisbane was one of the worst performers over the last month. Down 1.7% for the month, only Sydney (down 1.8%) recorded a larger loss.
- Regional South Australia is the only market to have made gains over both the last month and the last quarter. It has also seen the strongest growth over the last year (up 22.2%), with Adelaide coming in second (up 19.2%).
2. Stratified Capital City Market Changes
Key points to note:
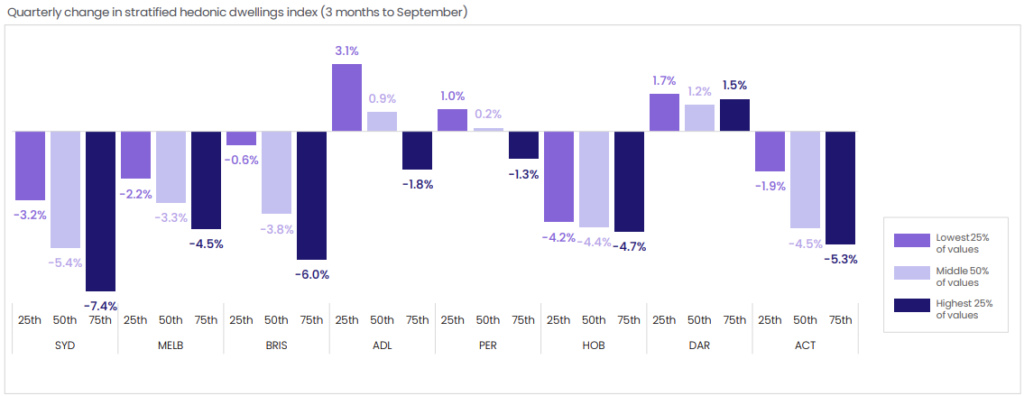
- In most markets, high value properties continue to be the strata hardest hit by the recent downward trend in prices.
- In Adelaide, the most affordable properties are significantly outperforming the rest of the market. While the city’s median price increased 0.1% over the last quarter, the lowest end of the market increased by 3.1%.
- Darwin is the obvious anomaly, with all market strata seeing growth over the last quarter. It is also the only capital where the highest end of the market is not the worst performing.
3. Change in New Listing Volumes by Region
Key points to note:
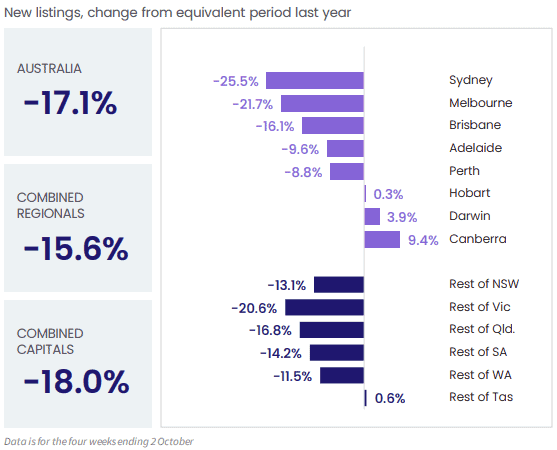
- As it is the start of the Spring Selling Season, September usually sees a significant upswing in new listings. This trend has been much more muted this year with levels significantly below last year and the 5 year average.
- The reduced flow of new listings suggests that rising interest rates are not causing too much financial distress for homeowners. If it continues, it could also help reinforce the market, slowing the decline in dwelling vales and reducing total losses.
- Hobart (up 0.3%), Regional Tasmania (up 0.6%), Darwin (up 3.9%), and Canberra (up 9.4%) are the only markets recording higher new listing levels than last year.
4. Change in Total Listing Volumes by Region
Source: Monthly Housing Chart Pack (CoreLogic)
Key points to note:
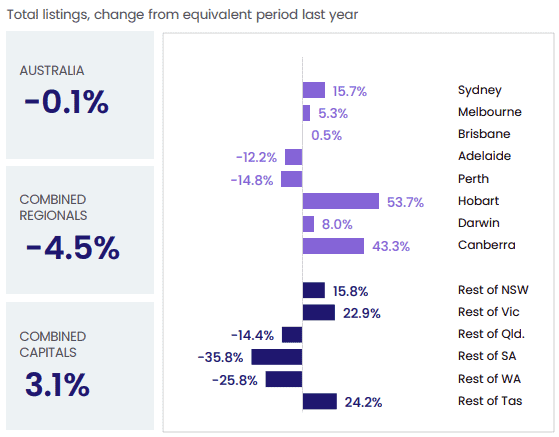
- While new listing volumes are trending lower than average, national total listing volumes are largely consistent with last year’s numbers.
- Comparative advertised stock levels vary significantly across different markets, with a clear correlation between market performance and listing volumes. Markets that are currently weakest – like Sydney, Hobart, Canberra, Regional NSW, and Regional Victoria – all have higher than average supply. However, markets that are currently performing better – like Adelaide, Perth, and Regional South Australia – have less properties listed for sale.
- The variation in stock levels appears to be more of a reflection of reduced buyer interest than an oversupply issue. This is also reflected in sales activity data.
5. Days on Market by Region
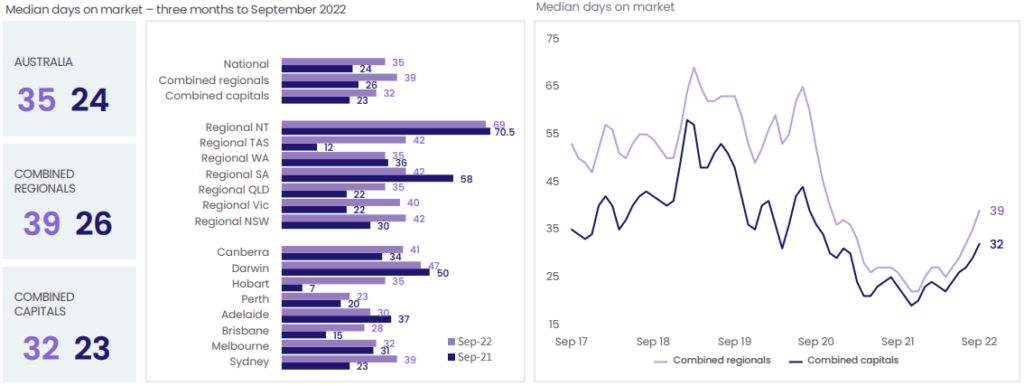
Key points to note:
- Properties are sitting on the market much longer than they were this time last year (35 days v 24 days). This increase has been particularly pronounced in the regions, where the median days on market has increased by 50%.
- Tasmania is leading this trend, with Hobart adding 28 days to the median sale timeline and Regional Tasmania adding 30 days.
- Adelaide and Darwin are the only capitals to buck this trend, reducing their days on market by 7 and 3, respectively. Regional South Australia (down 16 days), Regional Northern Territory (down 1.5 days), and Regional Western Australia (down 1 day) are also seeing faster sales.
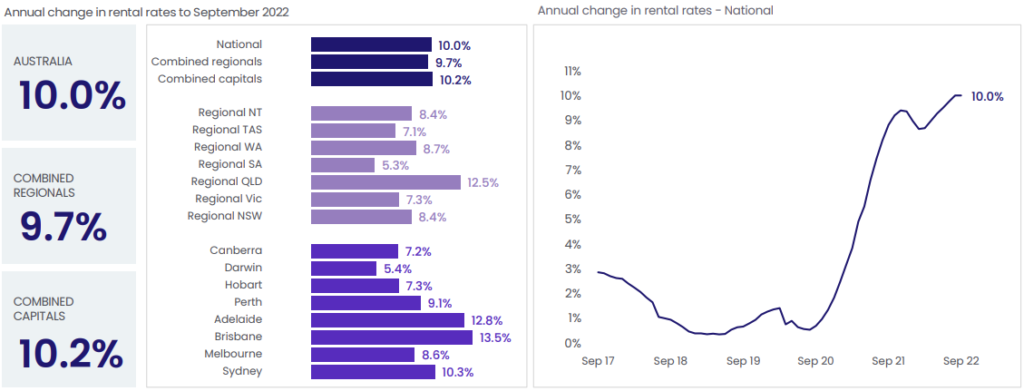
6. Change in Rental Rates by Region
Source: Monthly Housing Chart Pack (CoreLogic)
Key points to note:
- While the national median rental rate is continuing to rise, the speed of this increase is slowing. That said, the annual growth rate has held steady at a record 10% for another month.
- Growth in unit rents (up 11.8% for the year) is comfortably outperforming growth in house rents (up 9.4% for the year). Capital rental markets (up 10.2% for the year) are also outperforming regional rental markets (up 9.7%).
- Queensland continues to be the hotspot for rental growth, with Brisbane rents up 13.5% and Regional Queensland rents up 12.5%). Adelaide rentals have also performed well, with the median rent rate there climbing by 12.8% over the last year.
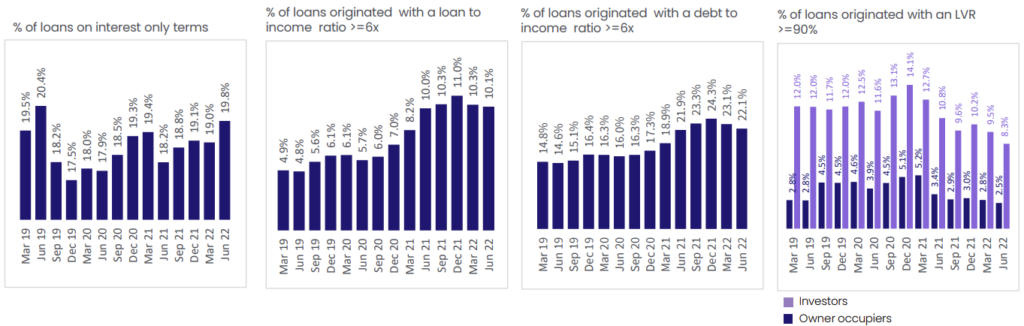
7. Change in Higher Risk Lending Rates
Source: Monthly Housing Chart Pack (CoreLogic)
Key points to note:
- There has been a general downward trend in the percentage of loans that fit into higher risk categories.
- This reflects the tightening of lending requirements, and the increasingly conservative approach buyers are adopting when it comes to borrowing.
- While the percentage of loans with higher income, debt, and loan value ratios is falling, interest only loans are gaining popularity.
3 Trends we are Watching
The Rate of Decline
Have we passed through the steepest slope of this downturn? And have buyers got over the shock of interest rates rising and started factoring future increases into their calculations? It is probably too early to tell, but the subtle steadying of the market seen in September is a positive sign.
There is no denying that the market is still quite volatile, and that increased supply or interest rates, for example, could accelerate the decline. Certain locations may still have a long way to fall. However, the property market is surprisingly resilient, so a period of stabilisation would not surprise.
New Listing Levels
The Spring Selling Season is usually one of the busiest periods for the real estate industry. Traditionally this is the time when both vendors and buyers start becoming more active, after being fairly quiet over Winter. But this year, property’s peak period has got off to quite a slow start.
Given the general state of the market, it is unsurprising that vendors are not rushing to sell. With prices continuing to fall in most areas, many will likely hold off on listing until things pick up.
Acknowledging this, a change to the flow of new listings would say a lot about the state of the market. If it significantly increases, it could also cause oversupply issues, putting further downward pressure on prices. However, if it continues to stay below average, it could create a supply shortage, potentially putting upward pressure on prices.
Interest Rates
We probably sound like a broken record at this point, but interest rates continue to be a major watchpoint. While the Reserve Bank’s latest 0.25% increase was smaller than most expected, it is the sixth consecutive monthly rate rise. The speed of the recent rate increases is also the fastest it has been since the early 1990s.
Now sitting at 2.6%, the cash rate is the highest it has been since July 2013. It is also higher than the average rate for the decade immediately preceding the COVID pandemic.
That said, the fact that the RBA opted for a smaller rate rise this month is significant. It suggests a recognition of the rapidly changing economy and a desire to monitor the impact of previous increases.
At Search Party Property, we specialise in developing tailored investment strategies and will work with you to come up with a suitable plan of attack. We also regularly assess your strategy ensuring that it is fit for purpose and delivering the desired results.


