- The first step is making the call.
- 1300 022 482
- hello@searchpartyproperty.com.au
As of 31st August 2022 – Property Market Update

The Australian property market’s decline continues to accelerate, with the national median dwelling value dropping 1.6% over the last month. This is the fourth consecutive month in negative territory and the largest monthly loss in almost 40 years. Darwin and Regional South Australia are the only markets to resist the downward trend, recording modest monthly price increases.
Despite recent drops, median prices remain well above the lows seen throughout the COVID period. In fact, Melbourne is the only market where prices are not still 15% or more above their COVID trough.
On the rental side, the median national rent rate continues to increase, up 0.8% for the month. This pushes the annual growth in rent rates to double digits (up 10.0%) for the first time since 2016. It has also contributed to the continued recovery of gross rental yields, which now sit at 3.29%.
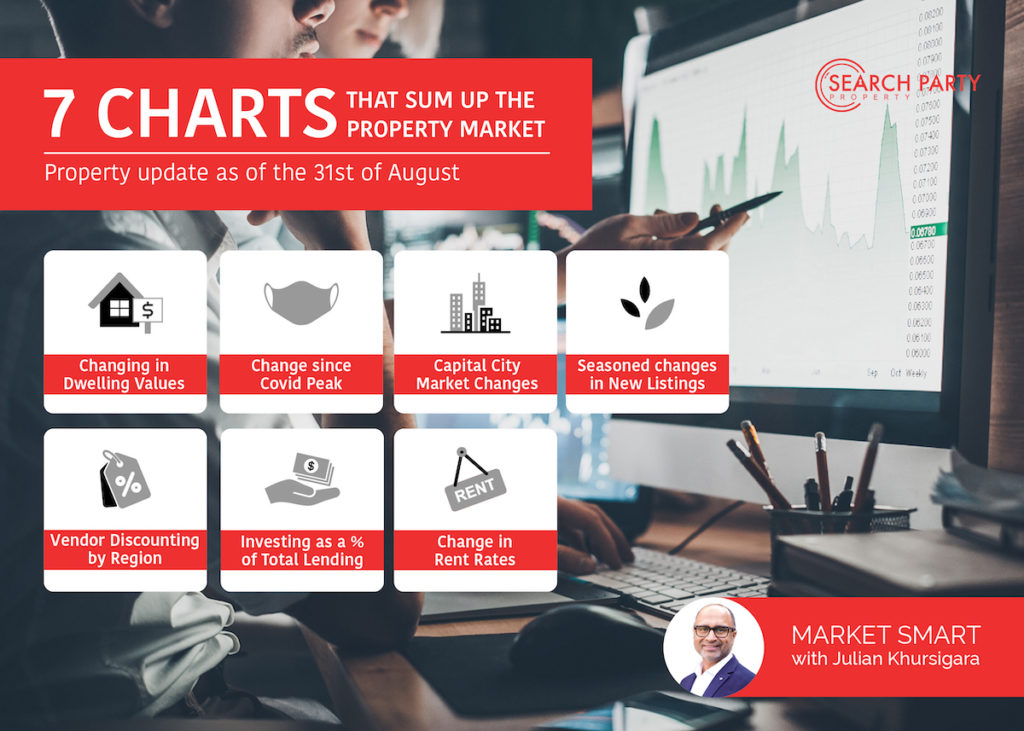
7 Charts that Sum Up the State of the Property Market
1. Change in Dwelling Values
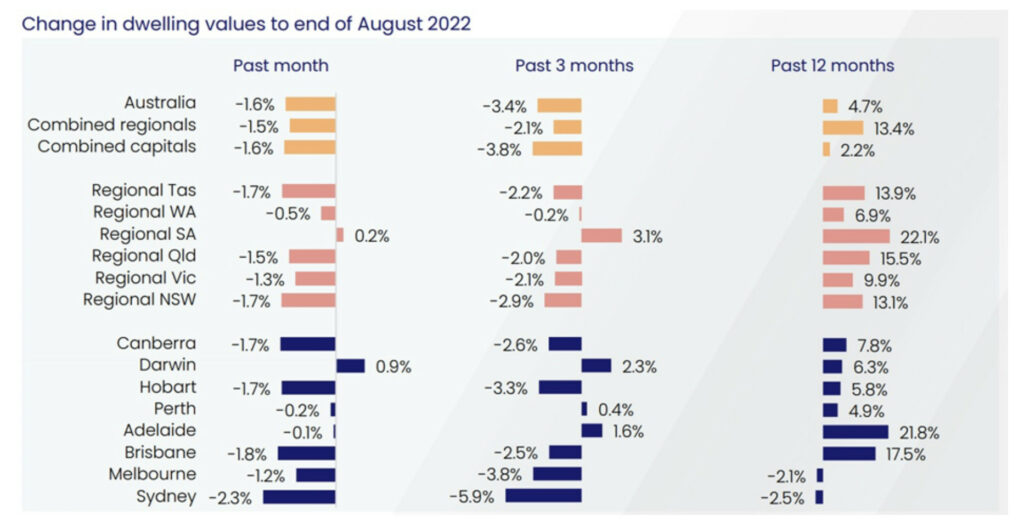
Key points to note:
- The median national dwelling value fell by 1.6% over August – this is the largest single month decline since 1983.
- Performance varies greatly across the regions. Sydney has fallen the furthest (down 2.3% for the month); whereas Darwin remains the strongest (up 0.9%).
- While the start of their decline was slower, regional markets have all but caught up with the capitals. This is largely being driven by the changing fortunes of the popular commutable lifestyle locations that recently experienced significant growth.
2. Change Since COVID Peak
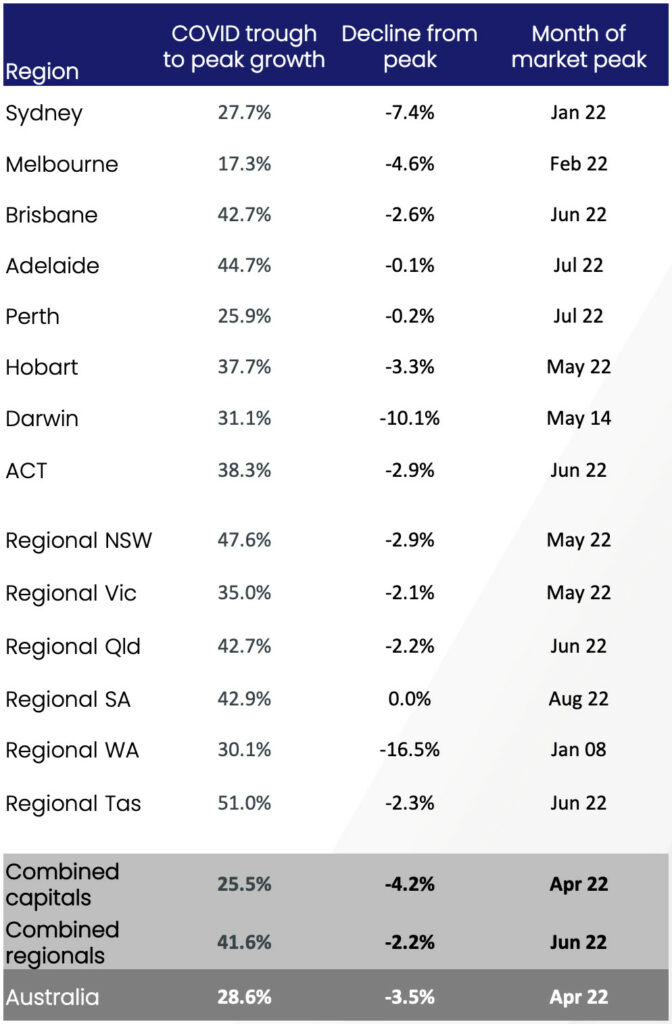
Key points to note:
- Despite recent drops, median prices remain well above the lows seen throughout the COVID period. In fact, Melbourne is the only market where prices are not still 15% or more above their COVID trough.
- While every other market is in decline, Regional South Australia reached its peak in August. As this market is remaining strong, property values in this region may still continue to grow over the coming months.
- While most markets have seen property values reach new heights this year, Darwin and Regional Western Australia did not pass their previous peaks. This is despite both locations seeing prices increase by over 30% over the COVID period.
3. Stratified Capital City Market Changes
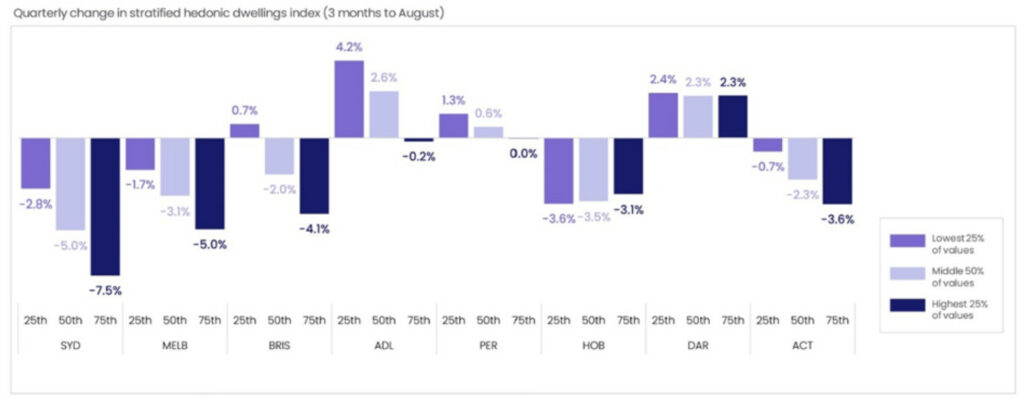
Key points to note:
- In most markets, the recent downward trend in prices becomes more pronounced as property values increase.
- This is most noticeable in Brisbane, where the lowest end of the market has actually increased in value over the last quarter. However, the city is down 2.5% on a whole-of-market basis due to notable declines in the other market strata.
- Hobart is the only capital to buck this trend, with the lowest value properties performing the worst over the last quarter. That said, all market strata have seen a fairly similar decline in values over this period.
4. Seasonal Changes in New Listings by Region
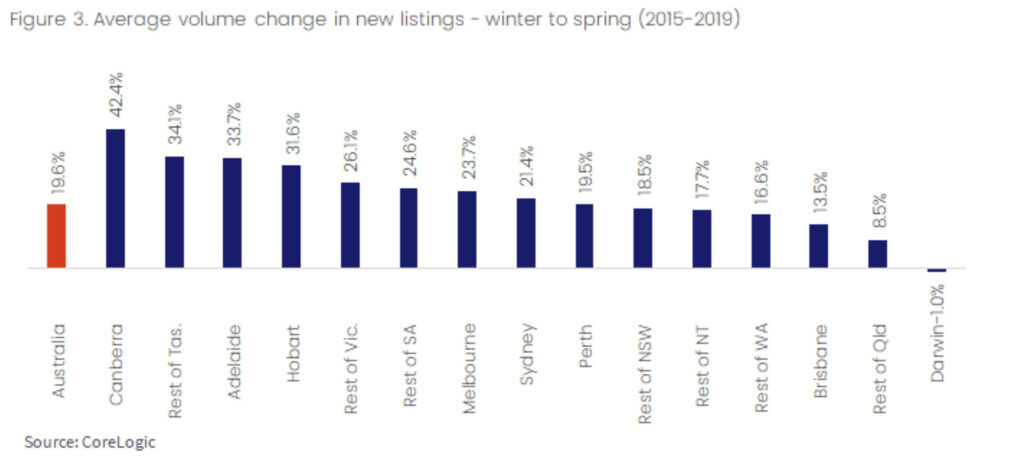
Source: 5 Things to Know for the 2022 Spring Selling Season (CoreLogic)
Key points to note:
- Prior to the pandemic, the change of seasons would see a notable increase in new listings in most property markets.
- How much of an impact the warmer weather has varies from location to location, with cooler climates more significantly affected.
- It is difficult to predict if this trend will hold true this year, particularly for the capitals. On a combined basis, new listings are already up 6.5% on the 5-year average, and available stock is up 13.4%. Demand is also waning, and the market downturn is likely to lead to some vendors delaying their plans to sell.
5. Vendor Discounting by Region
Key points to note:
- Due to the strength of the market, vendor discounting reached a cyclical low of 2.8% in the three months to April 2021. Since then, slowing sales have seen this increase to 4% over the last three months.
- Unsurprisingly, the biggest increase has been seen in Sydney where, this time last year, the median vendor discount was 2.8%. Since then, this number has almost doubled, to 5%.
- Regional Western Australia is the market bucking the trend, with discounting narrowly reducing over the last year (down 0.1%).
6. Investing as Percentage of Total Lending
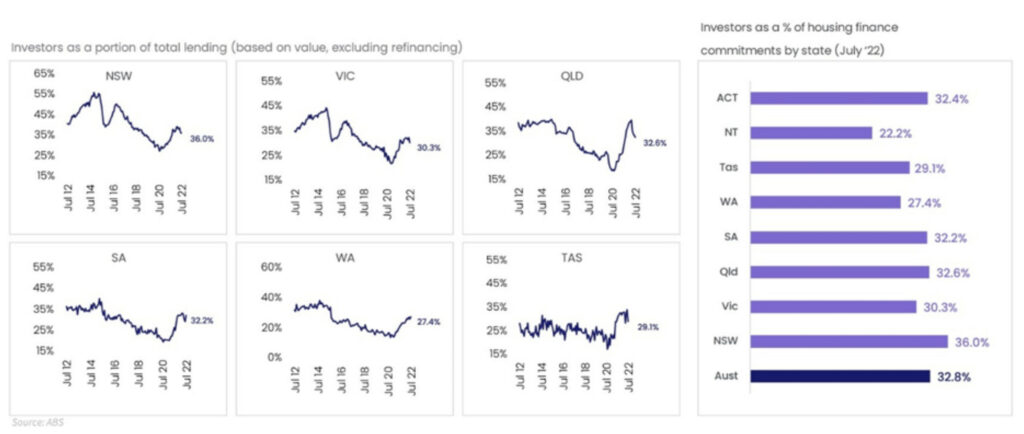
Source: Monthly Housing Chart Pack (CoreLogic)
Key points to note:
- Over the last decade, on average, investors accounted for 34.8% of new mortgage lending. In July, investor lending came in just below this long-term average, at 32.8%.
- This measure varies significantly from state to state, with NSW currently the highest (36%) and the NT the lowest (22.2%).
- While these numbers are down on the long term average, they are notably higher than the lows reached in 2020.
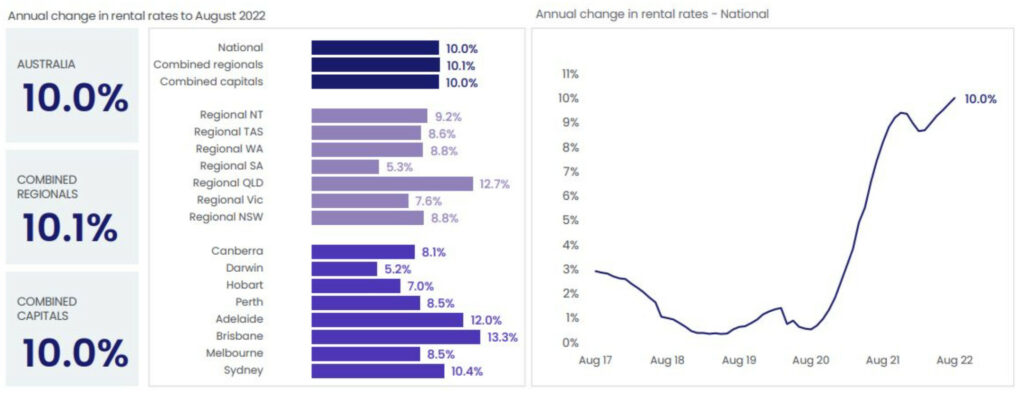
7. Change in Rent Rate by Region
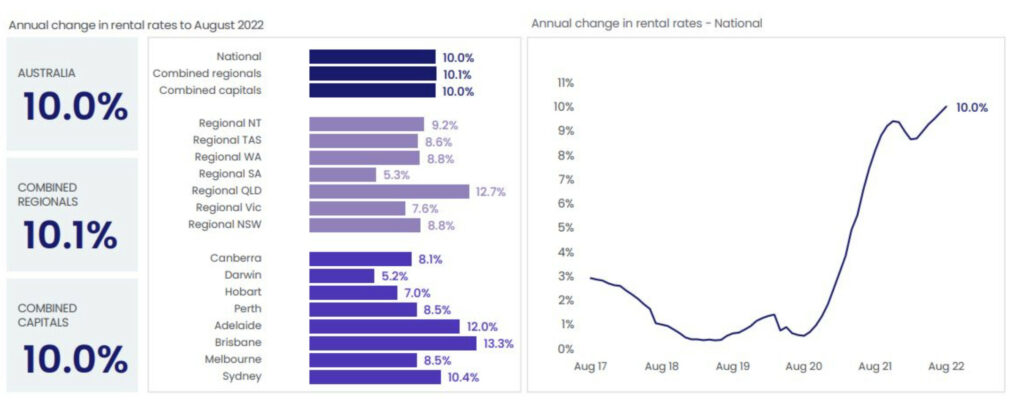
Source: Monthly Housing Chart Pack (CoreLogic)
Key points to note:
- The national median rent rate has increased by 10% over the last 12 months – this represents a new record growth rate.
- Increases have been largely consistent across most markets, though Brisbane and Regional Queensland are leading the growth trend. This reflects how competitive the rental market currently is in the Sunshine State.
3 Trends we are Watching
Regional property prices
Over the last 12 – 18 months, regional areas have really been the star performers of the Australian property market. When the market was on the up, several key regional areas were leading the growth trend. And, when the market started to turn, many regional markets remained in positive territory longer than most capitals.
However, the performance of regional markets is now largely in line with that of the capitals. The decline in dwelling values over August was similar – 1.6% for the combined capitals, and 1.5% for the combined regions. And some regions have seen prices decline by as much as the larger capitals over the last quarter.
Notably, the popular lifestyle locations that led the rise of the regional markets are also leading their fall. Most notably, over the last quarter, dwelling values have fallen 8.0% in the Richmond-Tweed area. There have also been significant losses in the Southern Highlands-Shoalhaven region (down 4.8%) and on Queensland’s Sunshine Coast (down 4.5%).
Rental affordability
While the growth in rental rates is great news for investors, the rate of growth is slowing in several markets. This is being driven by some key market segments, particularly in the capitals.
For example, standalone houses have seen median rents increase by 21.8% over the last year, across the combined capitals. By contrast, the median rent for units in the same areas has only increased by 10.8% over the same period. But this trend is turning, with unit rent increases significantly outpacing increases in house rents over recent months.
While there are several possible reasons for this, many experts believe it suggests houses are becoming unaffordable for many renters. If this trend continues, units may become the better option for investors looking to maximise their regular returns.
Interest Rate Increases
For the fifth consecutive month, the Reserve Bank has chosen to lift the cash rate. Now sitting at 3.35%, this is substantially higher than the record low of 0.1% seen earlier in the year. And, with the RBA continuing to raise concerns about inflation, further increases are expected.
So, the big question remains, how high will rates get? And how quickly will they get there?
While opinions vary, the general consensus is that the cash rate will likely peak at just over 4% by August 2023. This appears to be the assumption many financial market leaders are operating on, though most note that this is uncertain. However things play out, there is sure to be an impact on consumer confidence, borrowing power, and buyer demand.
At Search Party Property, we specialise in developing tailored investment strategies and will work with you to come up with a suitable plan of attack. We also regularly assess your strategy ensuring that it is fit for purpose and delivering the desired results.


