- The first step is making the call.
- 1300 022 482
- hello@searchpartyproperty.com.au

As of 31st October 2022 – Property Market Update

The national median dwelling value has declined for the sixth consecutive month, with almost every major market now recording losses. The annual growth rate has also moved into negative territory (down 0.9%) for the first time in almost 3 years. However, the rate of decline continues to slow, dropping from 1.4% in September to 1.2% in October.
On the rental side, growth in the national median rent has held steady at 0.6% for October. This is being driven by stronger unit markets, with the national median unit rent up 1.1% for the month.
7 Charts that Sum Up the State of the Property Market
1. Change in Dwelling Values
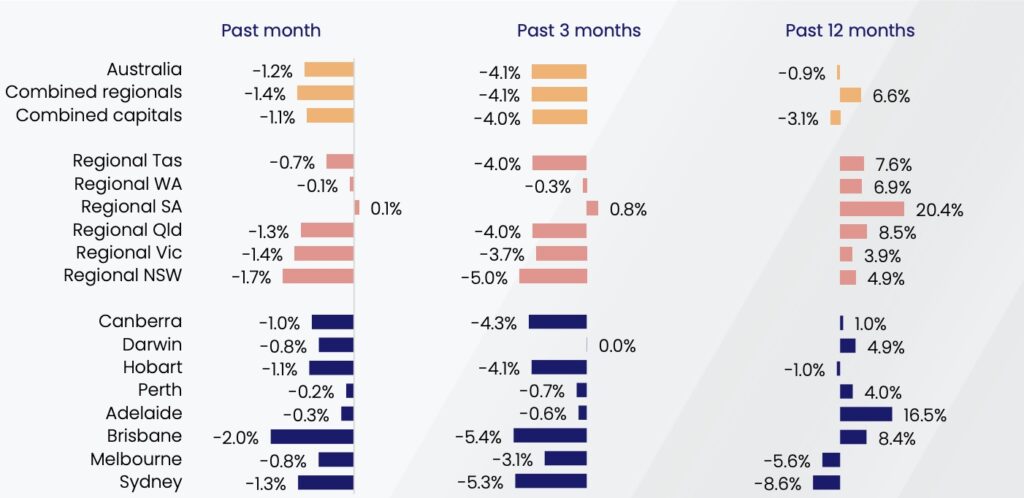
Key points to note:
- The median national dwelling value fell by 1.2% over October, which is a modest improvement on the 1.4% decline recorded in September. This means the rate of decline is continuing to slow, which could be a sign that the market is stabilising.
- While the national annual growth rate has slipped into negative territory (down 0.9%), this is due to losses in Sydney and Melbourne. In every other major market, except Hobart, prices remain higher than they were 12 months ago.
- Regional South Australia is once again the standout performer. It is the only major market to be in positive territory for the month (up 0.1%) and the quarter (up 0.8%). It has also recorded the strongest growth over the last year (up 20.4%).
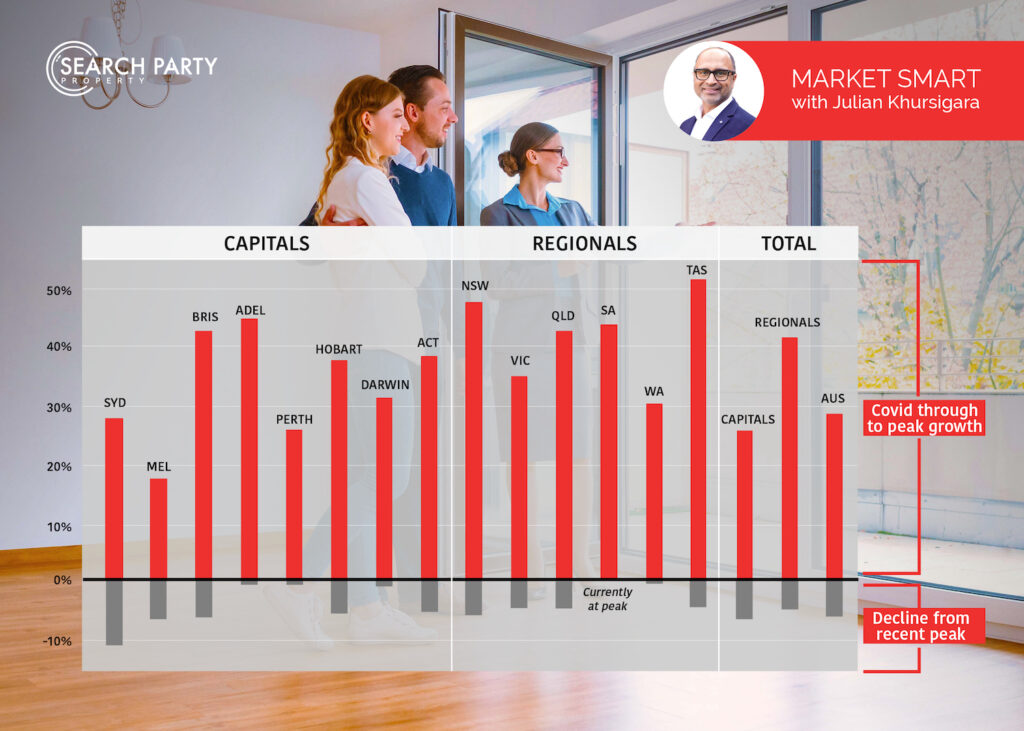
2. Change in Values Since Recent Peak
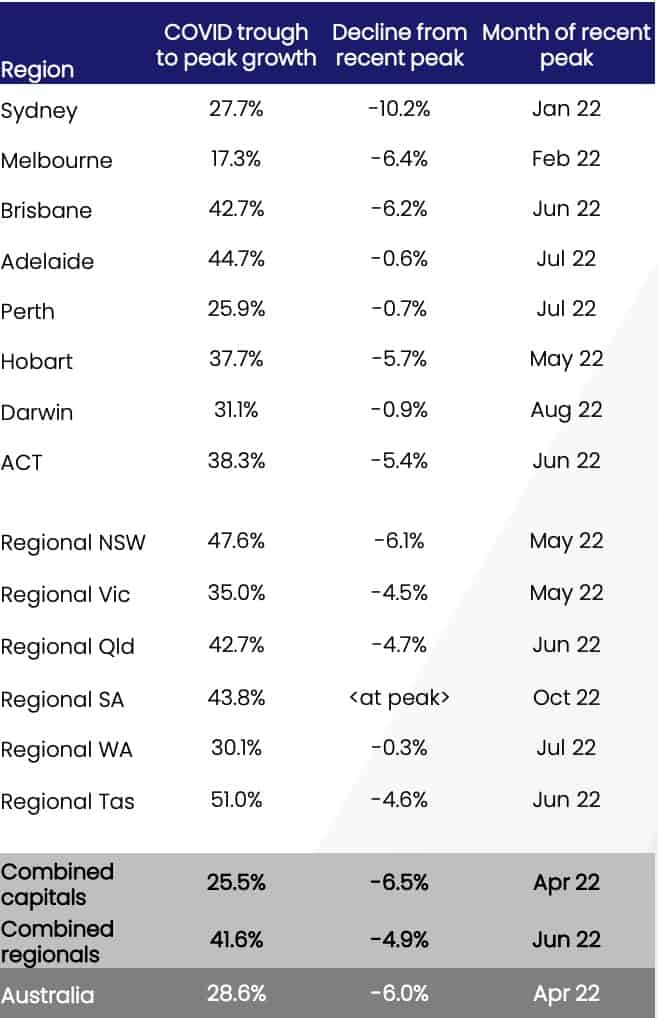
Key points to note:
- Despite recent declines, property prices remain higher in every major market than they were at the start of the pandemic. Even in Melbourne, which saw the most modest growth numbers, the median price remains comfortably above what it was pre-COVID.
- As the first major market to turn, Sydney has seen the largest drop from its cyclical peak. However, the downturn has been much sharper in Queensland and Tasmania (both the capital and regional markets). While these areas peaked several months later, they have recorded some of the largest declines.
- By digging further into the data, we can see exactly how widespread the downward trend actually is. Of the 310 sub-regions, only 16 – or approximately 5% – remain at their cyclical high. This includes some of the more affordable areas of Adelaide and Perth and a mix of regional locations.
3. Change in New Listing Volumes
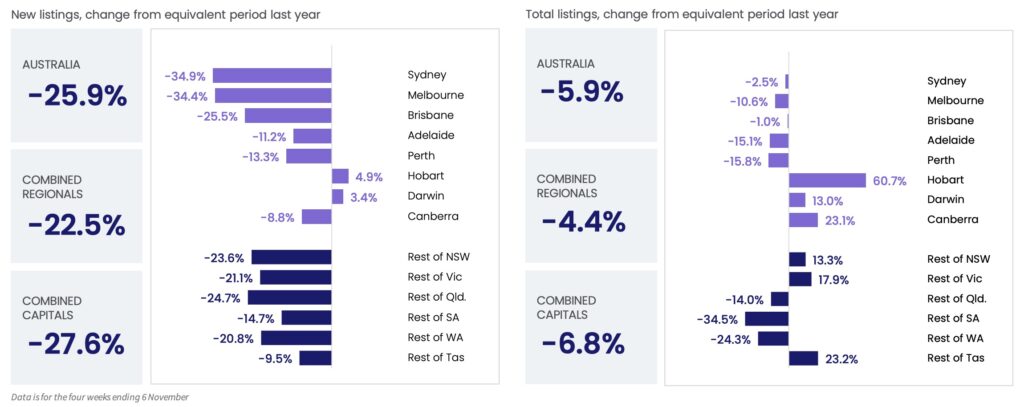
Key points to note:
- In most locations, the supply of new listings is significantly down on the levels seen this time last year. This suggests a reluctance by potential vendors to list their properties for sale, most likely due to declining prices.
- By contrast, while total listings are also down on last year’s levels, the gap is much less significant. In fact, several major markets are recording notably higher volumes of available properties – in particular, Hobart, where total listings are up 60.7%.
- The discrepancy between new listing and total listing levels reflects the general slowing of the property market.
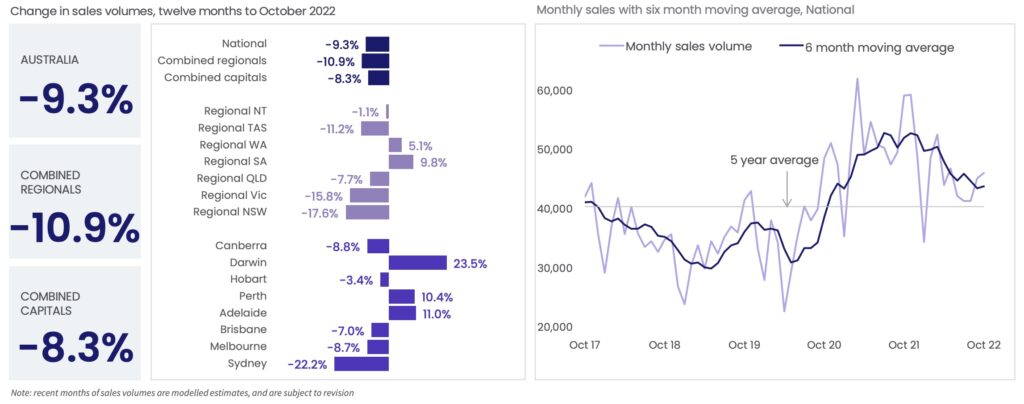
4. Change in Sales Volumes
Source: Monthly Housing Chart Pack (CoreLogic)
Key points to note:
- Buyer demand has also fallen significantly from the recent peak, with national sales volumes down 9.3% over the last year. Despite this decline, monthly sales volumes still remain comfortably above the 5-year average.
- While the overall trend is downward, relative sales volumes vary greatly across the major markets. Over the last 12 months, activity has significantly slowed in Sydney (down 22.2%), Regional NSW (down 17.6%), Regional Victoria (down 15.8%), and Regional Tasmania (down 11.2%). However, sales activity has notably increased in Darwin (up 23.5%), Adelaide (up 11.0%), and Perth (up 10.4%) over the same period.
- The lower levels of buyer demand are being at least partially offset by lower levels of supply in most locations. Many experts believe this is most likely helping slow the downturn in many of the major markets.
5. Change in Vendor Listing
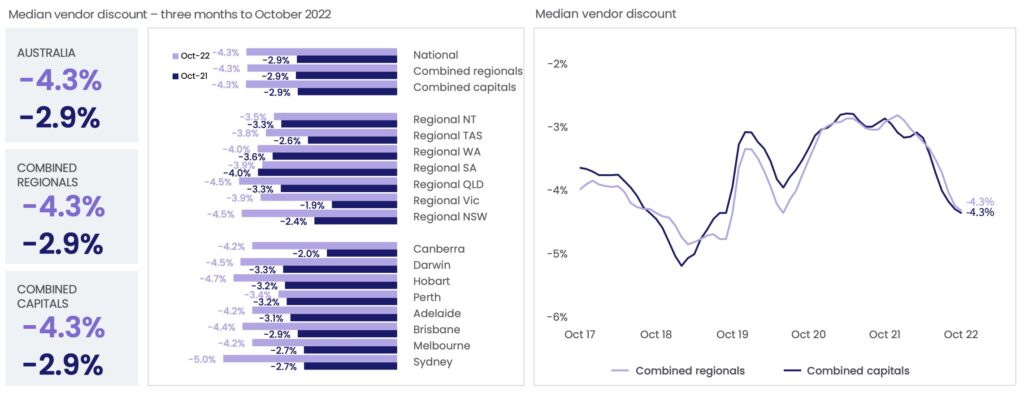
Key points to note:
- As the market slows, vendors are having to offer larger discounts to get deals done. As a result, the median vendor discount has increased by 1.4% – or $1,400 on every $100,000 – over the last year.
- Unsurprisingly, Sydney vendors have been under the most pressure, with the city’s median discount increasing 2.3% since October 2021. Canberra (up 2.2%), Regional NSW (up 2.1%), and Regional Victoria (up 2.0%) have also seen vendor discounts increase by more than 2%.
- Once again, Regional South Australia has bucked the trend, with the median discount actually falling 0.1% over the last year.
6. Change in Rental Rates
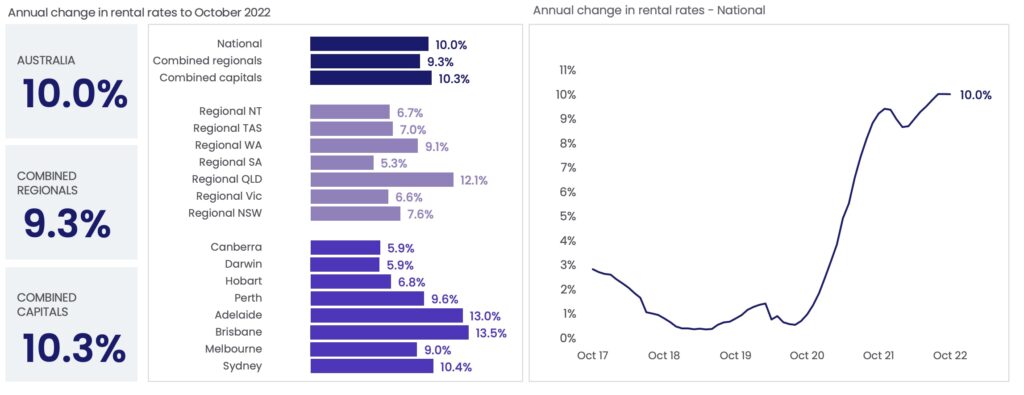
Source: Monthly Housing Chart Pack (CoreLogic)
Key points to note:
- The national annual growth in rents has held steady at 10.0% for the third consecutive month. The stabilising of this rate does not reflect the increasingly varying fortunes of the different market segments.
- Units continue to be the best performing property type, with the national median unit rent up 1.1% for the month. This brings the annual unit rent growth rate to 12.4% nationally.
- While Queensland is still recording the biggest increase in rents, the rate of growth has unquestionably slowed. Over the last month, the annual growth rate held steady in Brisbane (at 13.5%) and declined slightly in Regional Queensland (to 12.1%, from 12.5% in September).
7. Change in Rental Yields
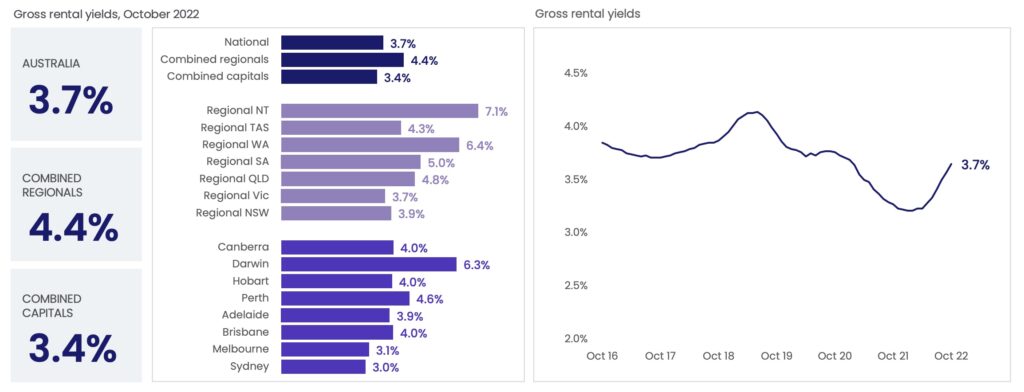
Source: Monthly Housing Chart Pack (CoreLogic)
Key points to note:
- After being at a record low of 3.21% in January, the national median gross rental yield has risen to 3.7%. This is the result of the declining property values and increasing rents we are seeing across the country.
- Yields are notably higher in regional markets than in the capitals, both within individual states and territories, and on a combined basis. This gap is smallest in Tasmania, with the gross rental yield only 0.3% higher in Regional Tasmania than Hobart. It is largest in Western Australia, where the gross rental yield is 1.8% higher in regional areas than it is in Perth.
3 Trends We Are Watching
1. Houses v Units
In most areas, house values are currently falling faster than unit values. This represents a complete reversal of the recent growth trend, which saw houses comfortably outperform units.
While there is most likely a number of reasons for this, affordability appears to be a key driver. Having risen significantly over the last couple of years, the cost of owning a house is now beyond many people. As such, to stay in their preferred area, an increasing proportion of buyers are having to opt for a unit.
With further interest rate rises predicted and the cost of living continuing to increase, household budgets will be stretched even thinner. As such, we expect that this trend could become even more pronounced over the coming months.
2. Supply of properties
While the flow of new listings did increase somewhat over the last month, it remains well down on last year’s levels. It also sits comfortably below the 5-year average, which suggests the market is currently unseasonably “cool”.
At the same time, total listing volumes have remained fairly steady, albeit lower than last year and the 5-year average. Sales volumes are tracking fairly similarly, down on last year, but slightly above the 5-year average. This suggests that while the supply of new properties is limited, so is buyer demand.
However, we could still see a significant uptick in the number of properties being listed for sale, which would be worrying. Most notably because it would likely indicate widespread mortgage distress, brought on by the rising cost of property ownership. It would also throw out the delicate supply/demand balance and potentially re-accelerate the decline in property prices.
3. Interest Rates
As most market watchers expected, the Reserve Bank chose to increase the cash rate by another 0.25% earlier this month. In doing so, they also flagged that further increases would be required over the coming months to curb record inflation. As such, it appears interest rates will continue to be a major consideration for homeowners and investors alike.
It is worth noting here that a higher-than-normal percentage of borrowers currently have fixed term mortgages. This means they have been largely insulated from the impact of rising interest rates up to this point. However, once their fixed term comes to an end, they will be exposed to increased rates and higher repayments.
The longer the rate hikes go on, the larger the number of borrowers that will be impacted. Also, the higher rates get, the bigger the jump these mortgage holders will need to make after their fixed term. For many, this simply may not be something they can afford to do.
At Search Party Property, we specialise in developing tailored investment strategies and will work with you to come up with a suitable plan of attack. We also regularly assess your strategy ensuring that it is fit for purpose and delivering the desired results.


