- The first step is making the call.
- 1300 022 482
- hello@searchpartyproperty.com.au
Do Property Prices Really Double Every 7 Years?

You’ve probably heard that over a 7-10 year period, the value of Australian real estate will always double like clockwork. It’s a common rule of thumb.
But just how true is this? Does the pattern of history prove this to be false? Or is it indeed an accurate, high-level precis of the market’s intricacies?
To begin with, it’s important to understand what is required for a house to double in value. It sounds extraordinary, but thanks to the power of compounding, a house price doubling over 7 years requires an annual growth rate of just over 10.2%, while a 10-year period needs only 7.2% growth each year.
Taking a look at the market data, a long-term view reveals some interesting trends. According to CoreLogic research reported by Aussie, over the 25 years prior March 2022, the national median house value grew by an average annual rate of 6.8% – just short of our target 7.2%. In fact, apartment growth was even lower, experiencing just 5.9% annual growth.

So… myth busted?
Yes and no.
Yes, across national averages, annualised average growth over the past three decades has fallen short of our 10-year doubling standard. But crucially, this is an average rate of growth. Many properties will have fallen well short of this rate, but just as many others will have far exceeded it.
Furthermore, the range of investment properties one might consider buying as an investment represents only a tiny subset of Australia’s overall property market – generally this will be only a small fraction of the properties available within major population centres.
Therefore, taking 6.8% as our average, outperforming this by just 0.4% and achieving a 10-year doubling should be highly achievable over the long-term, potentially with the help of a buyers’ agent or through your own careful research.
In addition, it’s crucial to note that growth rates have been diverse. The property market is not a monolith; different regions, property types, and price points experience their own unique growth cycles. For instance, properties closer to central business districts, which are high in demand due to proximity to employment and amenities, have typically seen higher capital growth compared to outer suburban areas. This is further supported by research from the Australian Housing and Urban Research Institute, which found that suburbs near CBDs have outperformed more remote areas in terms of long-term capital growth (and we of course know this intuitively!).
As we’ve discussed in other articles – property markets move in cycles, characterized by periods of rapid growth and stagnation, but rarely prolonged decline. Within each 10-year period, it’s common to observe years with flat growth or even value declines, followed by periods of low growth and then a surge during the boom phase. Recognizing these cycles is essential for property investors, as the timing of investment and the location chosen can significantly impact returns.
Inflation
Now, to quickly throw a spanner in the works – analysis of this same question by other outlets often makes an egregious omission – inflation.
It’s critical to remember that the figures discussed above are all nominal, or in simple terms, not accounting for inflation. Of course, growth in the value of any asset is always undermined by the effect of inflation, which reduces the ‘value’ of a dollar and your purchasing power.
Using something called the fisher equation, we can understand the relationship at play here.
This fisher equation explains how inflation affects interest rates, and it looks like this:

Where:
r = ‘Real’ growth rate (inflation-adjusted)
i = Nominal growth rate
f = General inflation rate
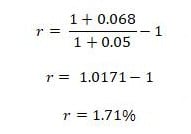
As an example, supposing we had a year of average 6.8% house price growth, but over the same period, inflation was 5%, our real rate of house price growth would be just 1.7%:
So, clearly, inflation can have a huge impact on our real, underlying rate of house price growth – and this is particularly evident within the last 30 years of historical data:
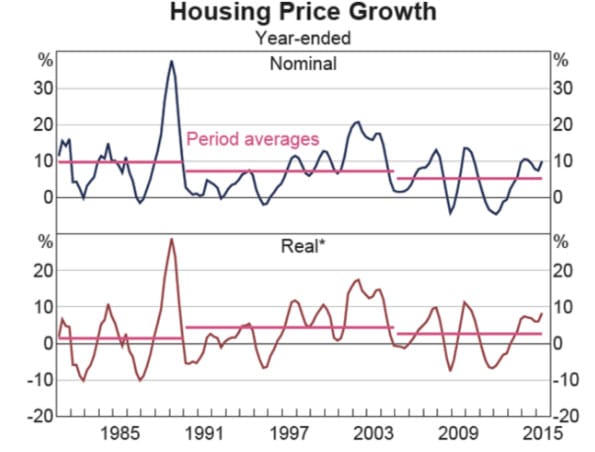
As you can see in the two charts:
1. In the 1980s, the average annual increase in housing prices was significantly higher, approximately 10%, which was in line with the general rise in prices across the economy. However, when adjusted for inflation, which was hovering around 10%, the growth in housing prices during this decade was relatively modest, averaging at 1.4% annually.
2. From the 1990s up until the mid-2000s, there was a notable annual rise in housing prices, with the nominal rate averaging 7.2% per year. This period experienced significant growth in the housing market alongside a lower rate of inflation.
3. Over the past decade, the average annual increase in housing prices has been slightly over 5% in nominal terms. This rate is lower than the rates observed in the previous periods, marking a decrease in the pace of housing price inflation.
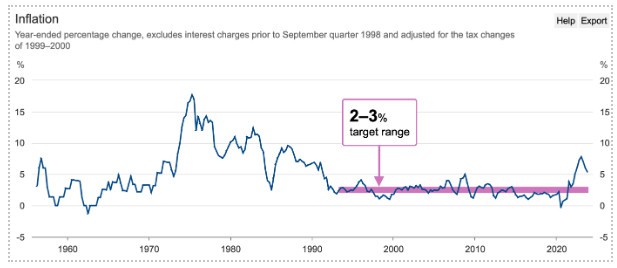
It just goes to show that when considering housing performance, it’s useful to consider real figures. We might often revert to thinking of the housing market as an isolated system, but it’s always important to consider the impact of the broader economy that it operates within.
So then, returning to our original question… In real terms, the housing market as a whole tends to fall well short of doubling every 7-10 years, especially with the inflation level of the last couple of years.
Though again, as mentioned, that small collection of ideal investment properties are another story – it’s just a matter of finding them!
Want to discuss this further?
For expert guidance in property strategy, and what it could mean for you as a property investor, book in for a free consultation to make informed decisions, tailored to your investment goals. Don’t let affordability challenges hinder your success. Act now with Search Party Property!

