- The first step is making the call.
- 1300 022 482
- hello@searchpartyproperty.com.au
Is The Property Boom-bust Cycle Real?

The concept of the boom-bust cycle has a long history. In fact, it goes all the way back to a major stock market crash known as the Panic of 1825, when large investments failed in several South America countries (including a fake country!). The crisis led to the collapse of 12 banks in Britain alone and was felt across Europe and both American continents.
Until this point, economists had generally believed that economic downturns were the result of purely external factors, like war – but the situation in 1825 didn’t seem to fit this rule. Swiss economist De Sismondi was first to point this out and thus give rise to concept of the “boom-bust”, or economic cycle. The idea being that capitalist economies are subject to continual cycles of economic expansion and contraction:
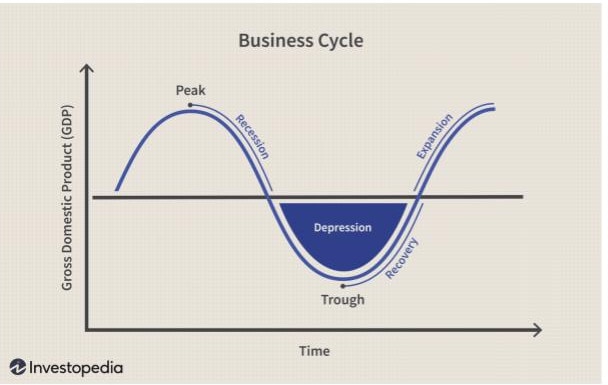
Over time, De Sismondi’s original work has been reimagined endlessly. Experts of all fields have continued to dream up new ways of modelling both the patterns of the past and those yet to come, based upon new indicators and timeframes.
One fascinating example of this was created by Samuel Benner, a farmer, who in 1875 published a book explaining his attempts at understanding market cycles. Below is a business card Benner distributed, apparently full of confidence in his theory!
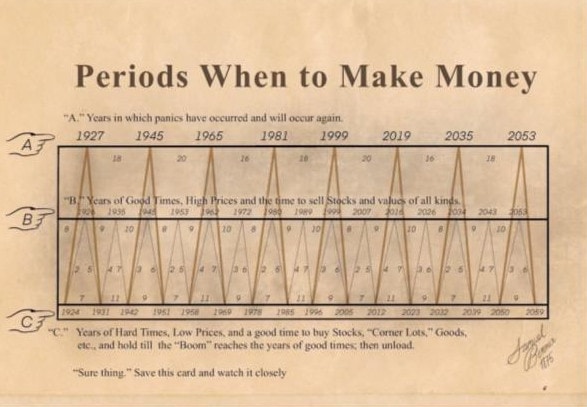
Impressively, Benner would have been well prepared for 2008, despite living well over a hundred years prior!
However, interesting as they may be, modern research tells us that attempts to model the economy in such rigid ways will, more often than not, fall flat – particularly when it comes to property.
Cycles in Australia’s Real Estate Market
The Australian property market, while not immune to global economic shocks or regulatory changes, has shown a unique resilience over time when compared to other global markets. With a quick look at historical price data, it becomes clear that rigid “boom-bust” dynamics haven’t typically applied in the same way to the Australian housing scene as might be observed elsewhere.
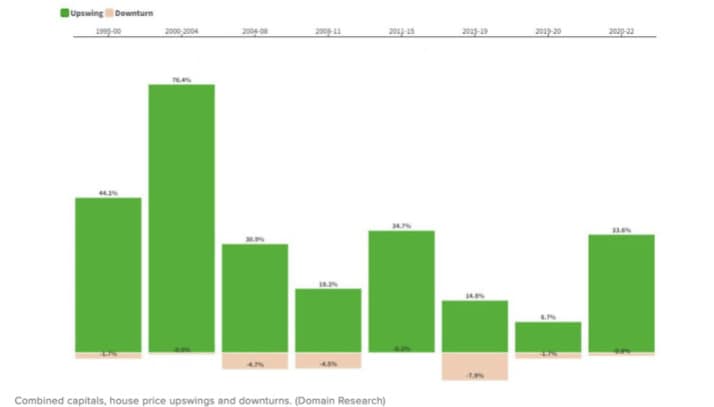
Even after significant price upswings, the market has experienced only modest retreats, with downturns lasting just a quarter of the time of the preceding boom. Since the 1990s, only four notable downturn phases have been observed, each influenced by distinct factors and followed by robust recoveries. Particularly in high-end markets like Sydney and Melbourne, while vulnerability is higher during downturns, they also lead in growth during upswings, underscoring the importance of a long-term perspective over attempting to “time the market.”
Future Cycles and Supply Inelasticity
In the property market, supply inelasticity refers to a situation where the quantity of housing supplied is less responsive to changes in price. In other words, situations where supply is more stagnant during shifts in demand:
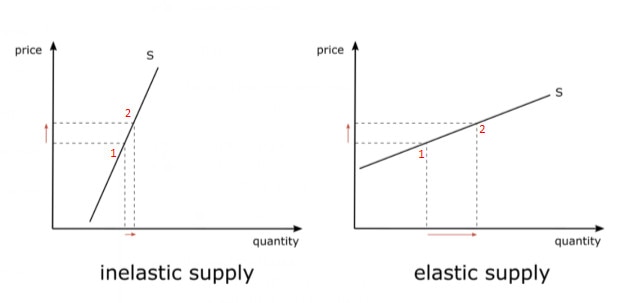
The charts above show two different supply curves, both subject to the same increase in price. Due to the angle of the supply curve (S), the same change in price can result in two different changes in quantity. This is what is meant by the ‘elasticity’ of supply – it’s the degree to which the quantity of a good in the market will respond to a change in the price. Visually, the angle of the supply curve is used to represent its elasticity.
This is particularly relevant to Australia’s housing market, which currently resembles the chart on the left. Unprecedented migration levels (more than 500,000 net overseas migration already this year) are flooding the market with new buyers, raising prices, but there simply aren’t enough houses for all of the new buyers:
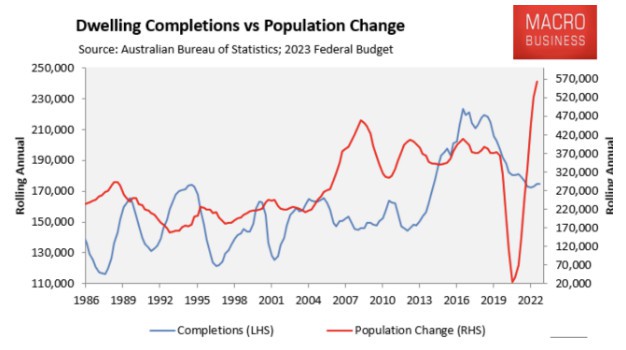
But just why is housing supply in Australia so inelastic despite the surging demand? Overall, the sheer scale of the imbalance is to blame. The government’s highgly ambitious target of 1.2 million new homes in 5 years (that’s 628 houses a day, for five years straight) has attracted major criticism from builders and developers, with many predicting that to even half that figure of new homes will be difficult to achieve.
It all indicates that the housing shortfall is unlikely to be resolved any time soon, and though we can’t predict the exact timing of future property market cycles and downturns (as Samuel Benner might claim!), this supply imbalance offer a couple of hints about what property boom-bust cycles will look like into the future.
Crucially, market dynamics become less predictable when inelastic supply is at play. Shocks to the market, like policy changes, geopolitical events, or even natural disasters, can sway demand and trigger more rapid changes in the market. Without flexible, adaptable supply levels, these shifts become even more pronounced and aggressive.
Boom-bust cycles in property are beginning to take on unique dynamics. While prices look set to continue rising, we are witnessing higher levels of systemic, underlying risk driven by ‘immigration-induced’ supply inelasticity.
This isn’t to say that there isn’t still investment opportunities or money to be made – there absolutely are! But these unique market conditions do underscore the need for careful planning, due diligence and investment advice, next time you go to buy.
Want to discuss this further?
For expert guidance in property strategy, and what it could mean for you as a property investor, book in for a free consultation to make informed decisions, tailored to your investment goals. Don’t let affordability challenges hinder your success. Act now with Search Party Property!


