- The first step is making the call.
- 1300 022 482
- hello@searchpartyproperty.com.au
What are the best leading indicators for real estate? (Part 1)

For real estate markets, one distinctive characteristic sets it apart from other, more fluid markets – a slower cadence. Unlike the constant volatility of stock markets, real estate is a slow burn. By the time sensational headlines proclaim an ‘explosion’ of house prices in a particular area, the conditions responsible for that headline had likely begun to coalesce months, or even years, beforehand. The headline you eventually see in the news, merely captures the crescendo of that slow collision of factors. It’s almost like tectonic plates inching towards each other unseen, eventually creating a sudden outcome that gets our attention.
Likewise, this slower pace comes with a slower rate of information. Where stocks or cryptocurrencies can maintain a constant stream of accurate, real-time data, real estate poses obvious challenges in that department. A lower rate of transactions and lack of real-time reporting means that even the latest real estate data can be out of date by the time we see it. Our latest data can probably describe last month’s market well enough, but what could’ve happened in the time it took to arrive?
Another important concept here is leading and lagging indicators. In this context, a leading indicator is some piece of information that gives us some hints concerning future real estate performance while, as you can probably guess, a lagging indicator is a piece of information that only describes the past. Lagging indicators tend be more commonly used in discussions of the property market in the media, but of course, the past doesn’t necessarily tell us anything about the future.
So, with these unique challenges in mind – an intrinsically slow market, and a slow rate of information – how can we identify property market trends before they’ve been and gone? Is there such a thing as reliable, forward-looking, lead indicators in real estate? What can we infer from real estate data about the future?
Strength vs Direction
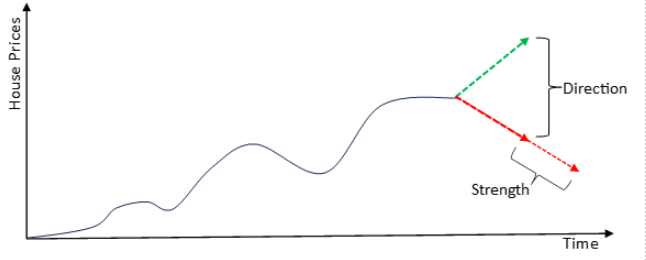
Before we look more closely at a few forecasting ideas, there’s an important distinction to make. Forward looking indicators can be broadly split into two separate buckets – those that describe the strength of a price movement, and those that describe the direction of a price movement.
In other words, some information might tell us about the direction of house prices (i.e. up or down, growth or decline, broadly speaking), while other information might tell us about how severe a movement will be – the magnitude of the change (i.e. a 5% change vs 10% change). Generally, a certain type of information will tell us more about one than the other, but it can often reveal a little about both, given context.

Importantly, both strength and direction are important to us as investors.
Directional indicators can help us to avoid areas that are likely to decline in price, while strength indicators can help us to maximise our returns by prioritising those areas likely to rise the most.
Check in for Part 2, where we’ll check out a few example indicators!
With that groundwork out of the way, let’s take a closer look at a few example indicators.
Want to discuss this further?
For expert guidance in property strategy, and what it could mean for you as a property investor, book in for a free consultation to make informed decisions, tailored to your investment goals. Don’t let affordability challenges hinder your success. Act now with Search Party Property!


