- The first step is making the call.
- 1300 022 482
- hello@searchpartyproperty.com.au
YIELD CURVE INVERSION – Are We Heading For a Recession? Part 2 of 2

In the previous article, we began to explain the yield curve by looking at the mechanics of bonds and bond markets – start there if you haven’t already!
In this article, we’ll tackle the yield curve, and examine what it can tell us about the likelihood of a recession.
Pulling everything together from before, we arrive at the yield curve:
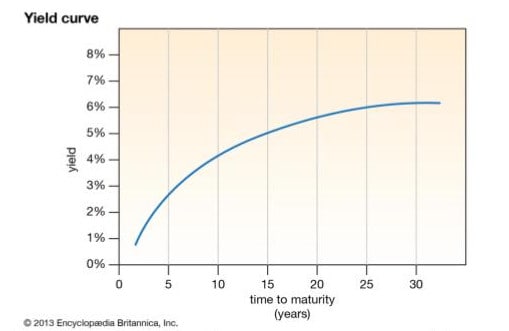
A yield curve is a visual comparison of bonds of equal default risk (the chance that the bond issuer cannot pay back investors), but varying maturities. The yield curve of Australian government bonds – often referred to as simply “the” yield curve – compares the yield of bonds issued by the Australian government with different maturities. Crucially, these bonds all possess the same AAA credit rating, which makes it possible to directly compare them.
If we plot all government bond yields, with yield on the y-axis and maturity on the x-axis, we should in theory see a diminishing positive slope like this:

The logic here is that bonds issued for a longer maturity carry a greater risk because of the higher probability of inflation or default as more time goes by. In exchange for taking on this added risk, longer bond maturity is compensated with greater bond yields.
But as we alluded to earlier, the shape of this curve can look very different!
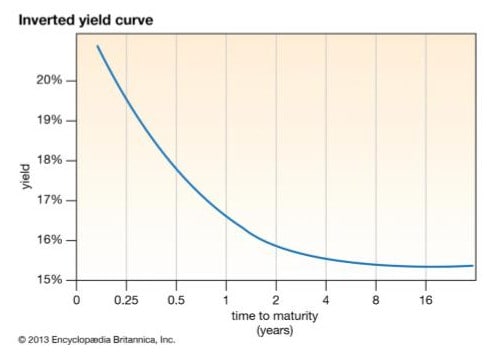
Sometimes, as has just occurred here in Australia, the curve can invert to look more like this:

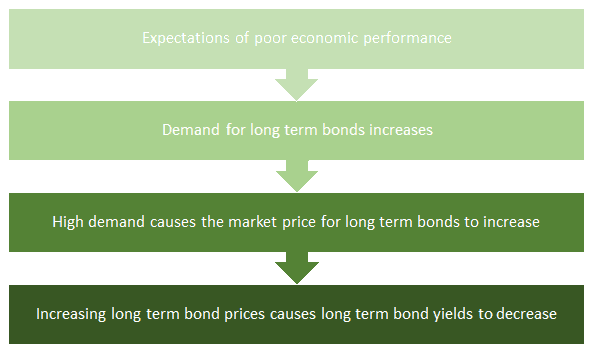
This phenomenon can occur when the expectations of future economic performance are considerably poor. Since long term treasury bonds are (theoretically) one of the best places to avoid losing money in times of economic turmoil, the demand for these long-term bonds can skyrocket if investors expect that a recession may be imminent.
The (oversimplified) series of events can look something like this:

Historically, yield curve inversions have been correlated with economic downturns and recessions. When the yield curve inverts, with long-term bond yields falling below short-term bond yields, it reflects pessimistic market sentiment about future economic performance.
So, while this may not alone confirm the media’s click-bait-driven ‘crisis’ headlines – it is true to say that markets have ‘priced in’ expectations of poor economic performance, and it’s something to keep an eye on in the months ahead.
Want to discuss this further?
For expert guidance in the implications of the yield curve, and what it could mean for you as a property investor, book in for a free consultation to make informed decisions, tailored to your investment goals. Don’t let affordability challenges hinder your success. Act now with Search Party Property!


