Yield Curve Inversion – Are We Heading For a Recession?

Recently, there’s been no end of provocative and alarming headlines written about the Australian economy, with words like ‘crisis’ and ‘recession’ readily thrown around.
A major driver of this concern is that Australia’s yield curve has inverted – something that hadn’t happened previously since 2008.
But what makes this a big deal?
And what is a yield curve anyway?
To break this down, we first need to understand how government bonds work and what makes them an important component of the economy.
Fundamentally, a bond is a sort of loan. An investor pays the issuer of a bond some amount of money, in exchange for the issuer agreeing to return that amount to the investor by a later date.
All bonds are defined by three key pieces of information:
1. Face Value: This is the amount that the bond is ‘worth’.
The issuer of the bond receives this amount when an investor purchases their bond, and the issuer must eventually pay this same amount back to the investor.
2. Coupon Rate: If we think of a bond like a loan, this is the fixed interest rate on the loan.
For instance, if a bond has a face value of $100 and a coupon rate of 5%, then the issuer of the bond would pay the investor $5 each year.
(This might also occur twice-yearly or monthly depending on the bond.)
3. Maturity: This is the length of time for which the issuer must pay the coupon rate to the investor.
For instance, the issuer of a 5-year bond might be required to pay the coupon rate to the investor once a year, for each of the 5 years. At the end of this 5-year period, the bond is said to have ‘matured’, and the issuer must then also return the bond’s face value back to the investor.
To put it all together, let’s look at the example of a 5-year bond with a 5% coupon rate paid , in terms of cashflow.
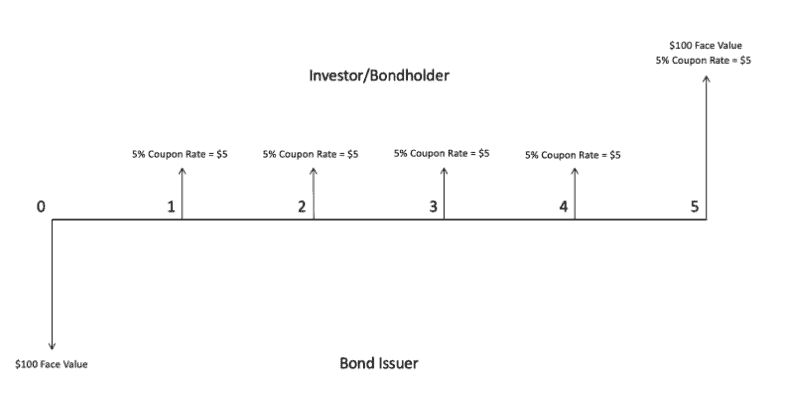
The size and direction of the arrows here indicate cashflow between the two parties.
As we can see, the bond issuer receives the bond’s face value immediately, and the investor receives regular and consistent coupon payments. At maturity, the investor gets one final coupon payment, alongside the return of the initial face value.
Government Bonds and Bond Yield
Where this can get more complicated is in the realm of government bonds such as Australian government bonds. These are bonds issued by the government to finance expenditure and manage national debts. Investors who purchase these directly from the government are said to be engaging in the primary market for bonds.
Since these bonds are ‘backed’ by a major government with a AAA credit rating, government bonds are one of the ultimate low-risk asset classes for investors. These bonds are some of the most widely traded bonds on secondary markets – being traded between institutional investors, banks, individuals, and even foreign governments, all before they reach maturity.
Like anything traded on a market with high enough volume (like stocks, commodities, etc) bond prices can fluctuate enormously depending on supply and demand factors. This means that bonds may be traded for well above or below their underlying face value depending on market conditions, in turn affecting the bond’s overall yield – the overall return from the bond.
To explain, let’s imagine a couple of very oversimplified scenarios with our example bond from earlier:
Scenario 1:
$100 face value, 5-year bond, is sold on a secondary market for $105.
In this scenario, the overall yield of the investment for the new bondholder has decreased. Since the buyer has paid $105 but will only receive a face value of $100 in 5 years’ time (plus coupon payments), their overall yield is lower than the yield generated by the original $100 face value.
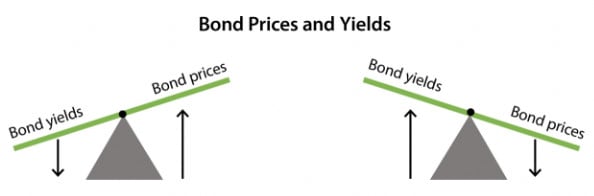
Price ↑ = Yield ↓
Scenario 2:
$100 face value, 5-year bond, is sold on a secondary market for $95.
This time, the overall yield of the investment has increased. Since the buyer has paid $95 but will receive a face value of $100 in 5 years’ time (plus coupon payments), their overall yield is higher than the yield generated by the original $100 face value.
Price ↓ = Yield ↑
Technically bond yields should also consider the time remaining until maturity (yield to maturity), but the general principle here holds true for our purposes.
When bonds are in high demand and their prices go up, the yield falls, and vice versa – an inverse relationship:
That’s how bonds and bond markets work (in a nutshell). Please keep an eye out for the next article – where we’ll look at the yield curve itself and explain what it can tell us about
Want to discuss this further?
For expert guidance in the implications of the yield curve, and what it could mean for you as a property investor, book in for a free consultation to make informed decisions, tailored to your investment goals. Don’t let affordability challenges hinder your success. Act now with Search Party Property!
Make confident property investment decisions. Book a free consultation with a buyer’s agent today.